SanJuan SJT full analysis,charts,indicators,moving averages,SMA,DMA,EMA,ADX,MACD,RSISan Juan SJT WideScreen charts, DMA,SMA,EMA technical analysis, forecast prediction, by indicators ADX,MACD,RSI,CCI NYSE stock exchange
operates under Energy sector & deals in Oil Gas Production
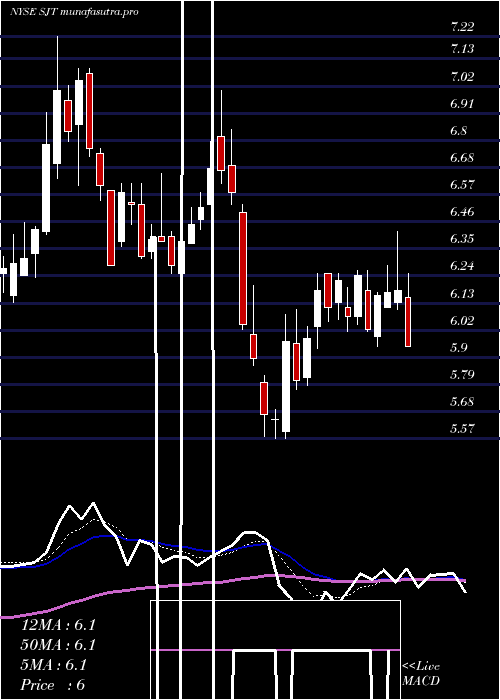
Daily price and charts and targets SanJuan Strong Daily Stock price targets for SanJuan SJT are 5.95 and 6.25 | Daily Target 1 | 5.73 | | Daily Target 2 | 5.86 | | Daily Target 3 | 6.03 | | Daily Target 4 | 6.16 | | Daily Target 5 | 6.33 |
Daily price and volume San Juan
| Date |
Closing |
Open |
Range |
Volume |
Fri 05 December 2025 |
5.99 (1.87%) |
5.90 |
5.90 - 6.20 |
0.9644 times |
Thu 04 December 2025 |
5.88 (1.91%) |
5.78 |
5.70 - 5.90 |
0.6738 times |
Wed 03 December 2025 |
5.77 (4.53%) |
5.58 |
5.53 - 5.79 |
0.9327 times |
Tue 02 December 2025 |
5.52 (-2.13%) |
5.58 |
5.46 - 5.69 |
0.8028 times |
Mon 01 December 2025 |
5.64 (0.18%) |
5.53 |
5.53 - 5.84 |
0.8869 times |
Fri 28 November 2025 |
5.63 (1.26%) |
5.56 |
5.56 - 5.70 |
0.2514 times |
Wed 26 November 2025 |
5.56 (3.35%) |
5.41 |
5.41 - 5.70 |
0.8616 times |
Tue 25 November 2025 |
5.38 (-4.44%) |
5.61 |
5.25 - 5.61 |
2.1513 times |
Mon 24 November 2025 |
5.63 (0.36%) |
5.60 |
5.56 - 5.80 |
1.6261 times |
Fri 21 November 2025 |
5.61 (-3.44%) |
5.87 |
5.59 - 5.87 |
0.849 times |
Thu 20 November 2025 |
5.81 (-1.19%) |
5.91 |
5.80 - 5.98 |
1.1018 times |
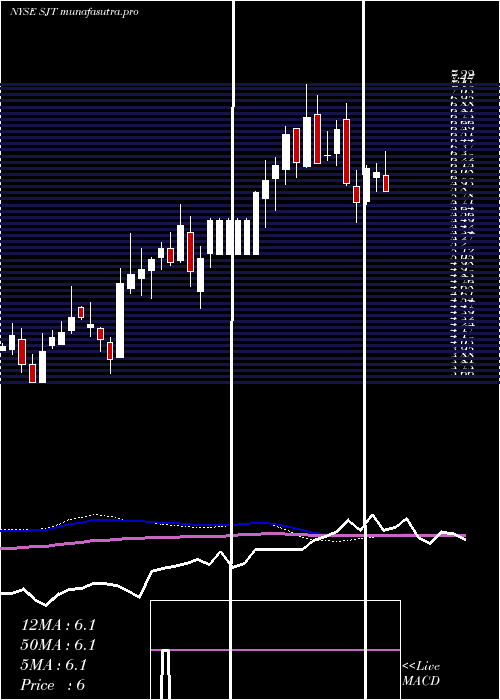
Weekly price and charts SanJuan Strong weekly Stock price targets for SanJuan SJT are 5.73 and 6.47 | Weekly Target 1 | 5.14 | | Weekly Target 2 | 5.57 | | Weekly Target 3 | 5.8833333333333 | | Weekly Target 4 | 6.31 | | Weekly Target 5 | 6.62 |
Weekly price and volumes for San Juan
| Date |
Closing |
Open |
Range |
Volume |
Fri 05 December 2025 |
5.99 (6.39%) |
5.53 |
5.46 - 6.20 |
0.9738 times |
Fri 28 November 2025 |
5.63 (0.36%) |
5.60 |
5.25 - 5.80 |
1.1177 times |
Fri 21 November 2025 |
5.61 (-12.89%) |
6.34 |
5.59 - 6.55 |
1.2623 times |
Fri 14 November 2025 |
6.44 (6.98%) |
6.16 |
5.96 - 6.52 |
1.232 times |
Fri 07 November 2025 |
6.02 (4.88%) |
5.71 |
5.71 - 6.17 |
0.6448 times |
Fri 31 October 2025 |
5.74 (0%) |
5.61 |
5.61 - 5.86 |
0.29 times |
Fri 31 October 2025 |
5.74 (5.71%) |
5.46 |
5.38 - 5.86 |
1.2235 times |
Fri 24 October 2025 |
5.43 (-0.55%) |
5.52 |
5.21 - 5.74 |
1.4527 times |
Fri 17 October 2025 |
5.46 (-12.78%) |
5.87 |
5.46 - 5.99 |
1.345 times |
Tue 07 October 2025 |
6.26 (-3.25%) |
6.48 |
6.24 - 6.52 |
0.4582 times |
Fri 03 October 2025 |
6.47 (8.19%) |
5.96 |
5.76 - 6.61 |
1.3017 times |
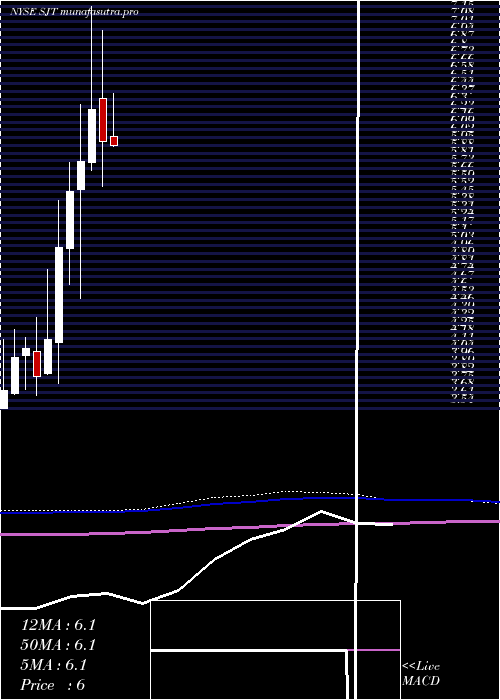
Monthly price and charts SanJuan Strong monthly Stock price targets for SanJuan SJT are 5.73 and 6.47 | Monthly Target 1 | 5.14 | | Monthly Target 2 | 5.57 | | Monthly Target 3 | 5.8833333333333 | | Monthly Target 4 | 6.31 | | Monthly Target 5 | 6.62 |
Monthly price and volumes San Juan
| Date |
Closing |
Open |
Range |
Volume |
Fri 05 December 2025 |
5.99 (6.39%) |
5.53 |
5.46 - 6.20 |
0.2063 times |
Fri 28 November 2025 |
5.63 (-1.92%) |
5.71 |
5.25 - 6.55 |
0.9018 times |
Fri 31 October 2025 |
5.74 (-4.97%) |
6.05 |
5.21 - 6.61 |
1.1811 times |
Tue 30 September 2025 |
6.04 (5.04%) |
5.71 |
5.68 - 6.36 |
0.8503 times |
Fri 29 August 2025 |
5.75 (-4.96%) |
6.00 |
5.54 - 6.04 |
1.1069 times |
Thu 31 July 2025 |
6.05 (1.17%) |
6.03 |
5.65 - 6.42 |
0.8695 times |
Mon 30 June 2025 |
5.98 (-4.78%) |
6.38 |
5.57 - 7.00 |
1.0102 times |
Fri 30 May 2025 |
6.28 (8.28%) |
5.79 |
5.72 - 7.22 |
1.8081 times |
Wed 30 April 2025 |
5.80 (4.88%) |
5.54 |
4.55 - 6.32 |
1.1933 times |
Mon 31 March 2025 |
5.53 (10.38%) |
5.00 |
4.67 - 5.79 |
0.8725 times |
Fri 28 February 2025 |
5.01 (20.14%) |
4.14 |
3.77 - 5.44 |
1.4717 times |
DMA SMA EMA moving averages of San Juan SJT
DMA (daily moving average) of San Juan SJT
| DMA period | DMA value | | 5 day DMA | 5.76 | | 12 day DMA | 5.69 | | 20 day DMA | 5.89 | | 35 day DMA | 5.78 | | 50 day DMA | 5.86 | | 100 day DMA | 5.84 | | 150 day DMA | 6 | | 200 day DMA | 5.82 | EMA (exponential moving average) of San Juan SJT
| EMA period | EMA current | EMA prev | EMA prev2 | | 5 day EMA | 5.82 | 5.73 | 5.65 | | 12 day EMA | 5.78 | 5.74 | 5.72 | | 20 day EMA | 5.79 | 5.77 | 5.76 | | 35 day EMA | 5.83 | 5.82 | 5.82 | | 50 day EMA | 5.85 | 5.84 | 5.84 |
SMA (simple moving average) of San Juan SJT
| SMA period | SMA current | SMA prev | SMA prev2 | | 5 day SMA | 5.76 | 5.69 | 5.62 | | 12 day SMA | 5.69 | 5.7 | 5.71 | | 20 day SMA | 5.89 | 5.89 | 5.9 | | 35 day SMA | 5.78 | 5.77 | 5.77 | | 50 day SMA | 5.86 | 5.85 | 5.85 | | 100 day SMA | 5.84 | 5.84 | 5.85 | | 150 day SMA | 6 | 6 | 6 | | 200 day SMA | 5.82 | 5.82 | 5.81 |
|
|
