SprottInc SII full analysis,charts,indicators,moving averages,SMA,DMA,EMA,ADX,MACD,RSISprott Inc SII WideScreen charts, DMA,SMA,EMA technical analysis, forecast prediction, by indicators ADX,MACD,RSI,CCI NYSE stock exchange
Daily price and charts and targets SprottInc Strong Daily Stock price targets for SprottInc SII are 90.62 and 92.88 | Daily Target 1 | 88.86 | | Daily Target 2 | 90.12 | | Daily Target 3 | 91.123333333333 | | Daily Target 4 | 92.38 | | Daily Target 5 | 93.38 |
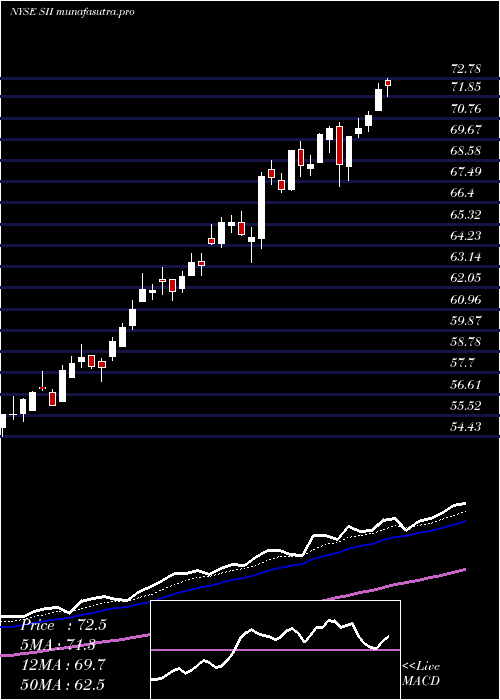
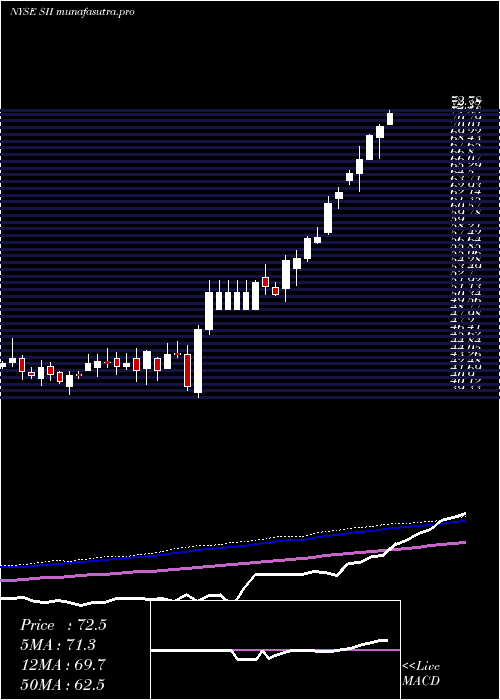
Daily price and volume Sprott Inc
| Date |
Closing |
Open |
Range |
Volume |
Thu 04 December 2025 |
91.37 (0.67%) |
89.89 |
89.87 - 92.13 |
0.4884 times |
Wed 03 December 2025 |
90.76 (1.27%) |
89.61 |
89.61 - 91.84 |
0.5547 times |
Tue 02 December 2025 |
89.62 (0.13%) |
89.87 |
88.15 - 90.16 |
0.8023 times |
Mon 01 December 2025 |
89.50 (-2.28%) |
92.13 |
89.39 - 92.14 |
1.2556 times |
Fri 28 November 2025 |
91.59 (1.52%) |
91.00 |
90.76 - 92.39 |
0.6864 times |
Wed 26 November 2025 |
90.22 (2.72%) |
88.50 |
88.00 - 91.38 |
0.91 times |
Tue 25 November 2025 |
87.83 (0.99%) |
86.72 |
85.89 - 88.15 |
1.3108 times |
Mon 24 November 2025 |
86.97 (6.96%) |
81.50 |
81.50 - 87.38 |
1.3101 times |
Fri 21 November 2025 |
81.31 (-1.68%) |
82.42 |
80.53 - 83.50 |
1.782 times |
Thu 20 November 2025 |
82.70 (-4.16%) |
87.33 |
82.70 - 87.64 |
0.8996 times |
Wed 19 November 2025 |
86.29 (-0.31%) |
86.99 |
86.05 - 88.65 |
0.9886 times |
Weekly price and charts SprottInc Strong weekly Stock price targets for SprottInc SII are 87.77 and 91.76 | Weekly Target 1 | 86.56 | | Weekly Target 2 | 88.97 | | Weekly Target 3 | 90.553333333333 | | Weekly Target 4 | 92.96 | | Weekly Target 5 | 94.54 |
Weekly price and volumes for Sprott Inc
| Date |
Closing |
Open |
Range |
Volume |
Thu 04 December 2025 |
91.37 (-0.24%) |
92.13 |
88.15 - 92.14 |
0.6745 times |
Fri 28 November 2025 |
91.59 (12.64%) |
81.50 |
81.50 - 92.39 |
0.9172 times |
Fri 21 November 2025 |
81.31 (-7.77%) |
87.91 |
80.53 - 88.65 |
1.3267 times |
Fri 14 November 2025 |
88.16 (-2.17%) |
91.82 |
86.24 - 94.83 |
1.2125 times |
Fri 07 November 2025 |
90.12 (9.97%) |
81.75 |
78.79 - 90.46 |
1.4188 times |
Fri 31 October 2025 |
81.95 (0%) |
81.36 |
81.23 - 82.33 |
0.1436 times |
Fri 31 October 2025 |
81.95 (-0.19%) |
81.70 |
78.79 - 83.77 |
1.1987 times |
Fri 24 October 2025 |
82.11 (-3.02%) |
85.12 |
80.01 - 86.50 |
1.2784 times |
Fri 17 October 2025 |
84.67 (-2.67%) |
84.07 |
82.78 - 89.48 |
1.4694 times |
Tue 07 October 2025 |
86.99 (3.37%) |
84.84 |
84.84 - 87.95 |
0.3601 times |
Fri 03 October 2025 |
84.15 (2.92%) |
82.55 |
81.49 - 84.64 |
1.1575 times |
Monthly price and charts SprottInc Strong monthly Stock price targets for SprottInc SII are 87.77 and 91.76 | Monthly Target 1 | 86.56 | | Monthly Target 2 | 88.97 | | Monthly Target 3 | 90.553333333333 | | Monthly Target 4 | 92.96 | | Monthly Target 5 | 94.54 |
Monthly price and volumes Sprott Inc
| Date |
Closing |
Open |
Range |
Volume |
Thu 04 December 2025 |
91.37 (-0.24%) |
92.13 |
88.15 - 92.14 |
0.1319 times |
Fri 28 November 2025 |
91.59 (11.76%) |
81.75 |
78.79 - 94.83 |
0.9537 times |
Fri 31 October 2025 |
81.95 (-1.49%) |
83.10 |
78.79 - 89.48 |
0.9709 times |
Tue 30 September 2025 |
83.19 (26.22%) |
65.95 |
64.90 - 83.82 |
1.2015 times |
Fri 29 August 2025 |
65.91 (-2.15%) |
67.00 |
61.94 - 69.53 |
1.1563 times |
Thu 31 July 2025 |
67.36 (-2.5%) |
69.15 |
67.14 - 77.16 |
1.1387 times |
Mon 30 June 2025 |
69.09 (19.2%) |
58.54 |
58.35 - 69.09 |
1.0364 times |
Fri 30 May 2025 |
57.96 (10.38%) |
52.01 |
50.56 - 59.14 |
1.2241 times |
Wed 30 April 2025 |
52.51 (17.03%) |
44.89 |
39.33 - 54.82 |
1.3344 times |
Mon 31 March 2025 |
44.87 (5.53%) |
42.73 |
40.81 - 45.90 |
0.8519 times |
Fri 28 February 2025 |
42.52 (-2.41%) |
43.46 |
41.16 - 45.00 |
0.5275 times |
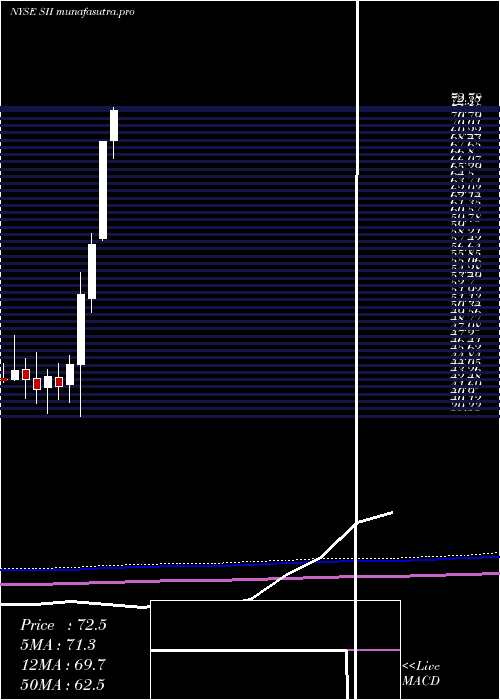
DMA SMA EMA moving averages of Sprott Inc SII
DMA (daily moving average) of Sprott Inc SII
| DMA period | DMA value | | 5 day DMA | 90.57 | | 12 day DMA | 87.89 | | 20 day DMA | 88.46 | | 35 day DMA | 86 | | 50 day DMA | 84.93 | | 100 day DMA | 76.66 | | 150 day DMA | 71.23 | | 200 day DMA | 64.78 | EMA (exponential moving average) of Sprott Inc SII
| EMA period | EMA current | EMA prev | EMA prev2 | | 5 day EMA | 90.28 | 89.74 | 89.23 | | 12 day EMA | 88.92 | 88.48 | 88.07 | | 20 day EMA | 87.85 | 87.48 | 87.14 | | 35 day EMA | 86.17 | 85.86 | 85.57 | | 50 day EMA | 84.38 | 84.09 | 83.82 |
SMA (simple moving average) of Sprott Inc SII
| SMA period | SMA current | SMA prev | SMA prev2 | | 5 day SMA | 90.57 | 90.34 | 89.75 | | 12 day SMA | 87.89 | 87.39 | 87.18 | | 20 day SMA | 88.46 | 88.09 | 87.65 | | 35 day SMA | 86 | 85.9 | 85.75 | | 50 day SMA | 84.93 | 84.56 | 84.19 | | 100 day SMA | 76.66 | 76.45 | 76.24 | | 150 day SMA | 71.23 | 70.97 | 70.72 | | 200 day SMA | 64.78 | 64.54 | 64.31 |
|
|
