SignetJewelers SIG full analysis,charts,indicators,moving averages,SMA,DMA,EMA,ADX,MACD,RSISignet Jewelers SIG WideScreen charts, DMA,SMA,EMA technical analysis, forecast prediction, by indicators ADX,MACD,RSI,CCI NYSE stock exchange
operates under Consumer Services sector & deals in Consumer Specialties
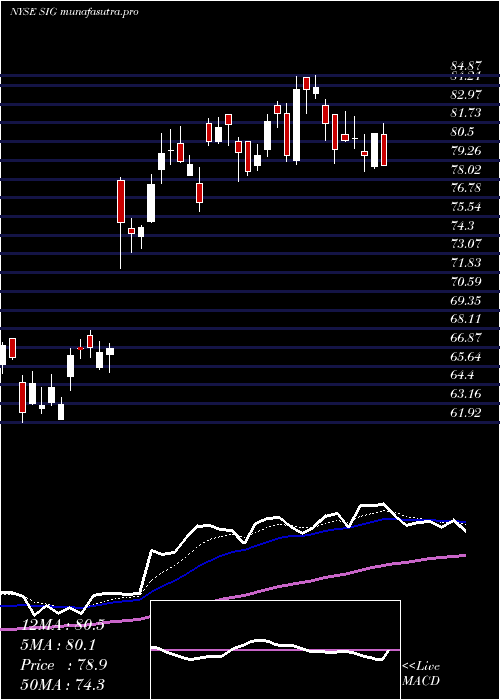
Daily price and charts and targets SignetJewelers Strong Daily Stock price targets for SignetJewelers SIG are 104.02 and 106.09 | Daily Target 1 | 102.34 | | Daily Target 2 | 103.63 | | Daily Target 3 | 104.41333333333 | | Daily Target 4 | 105.7 | | Daily Target 5 | 106.48 |
Daily price and volume Signet Jewelers
| Date |
Closing |
Open |
Range |
Volume |
Mon 20 October 2025 |
104.91 (1.62%) |
103.91 |
103.13 - 105.20 |
0.7194 times |
Fri 17 October 2025 |
103.24 (0%) |
102.43 |
102.30 - 104.07 |
1.0401 times |
Thu 16 October 2025 |
103.24 (-0.33%) |
103.21 |
101.90 - 104.30 |
0.9264 times |
Wed 15 October 2025 |
103.58 (2.38%) |
102.07 |
101.26 - 104.53 |
1.625 times |
Tue 14 October 2025 |
101.17 (1.37%) |
98.69 |
97.31 - 101.20 |
1.1943 times |
Mon 13 October 2025 |
99.80 (6.53%) |
95.10 |
94.15 - 99.92 |
1.0886 times |
Tue 07 October 2025 |
93.68 (0.06%) |
93.83 |
92.52 - 94.52 |
0.8687 times |
Mon 06 October 2025 |
93.62 (-3.14%) |
96.56 |
92.24 - 96.56 |
0.7176 times |
Fri 03 October 2025 |
96.65 (-1.93%) |
98.89 |
96.14 - 100.43 |
1.318 times |
Thu 02 October 2025 |
98.55 (2.92%) |
96.15 |
95.65 - 99.03 |
0.5019 times |
Wed 01 October 2025 |
95.75 (-0.18%) |
95.45 |
94.56 - 96.59 |
1.1026 times |
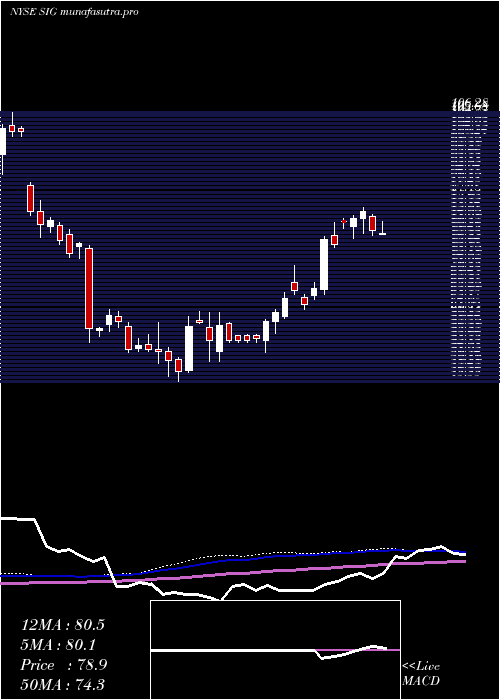
Weekly price and charts SignetJewelers Strong weekly Stock price targets for SignetJewelers SIG are 104.02 and 106.09 | Weekly Target 1 | 102.34 | | Weekly Target 2 | 103.63 | | Weekly Target 3 | 104.41333333333 | | Weekly Target 4 | 105.7 | | Weekly Target 5 | 106.48 |
Weekly price and volumes for Signet Jewelers
| Date |
Closing |
Open |
Range |
Volume |
Mon 20 October 2025 |
104.91 (1.62%) |
103.91 |
103.13 - 105.20 |
0.142 times |
Fri 17 October 2025 |
103.24 (10.2%) |
95.10 |
94.15 - 104.53 |
1.1593 times |
Tue 07 October 2025 |
93.68 (-3.07%) |
96.56 |
92.24 - 96.56 |
0.313 times |
Fri 03 October 2025 |
96.65 (0.62%) |
96.47 |
94.49 - 100.43 |
0.9216 times |
Fri 26 September 2025 |
96.05 (0.19%) |
95.94 |
93.98 - 97.60 |
0.9255 times |
Fri 19 September 2025 |
95.87 (5.27%) |
91.18 |
90.24 - 97.88 |
1.2256 times |
Fri 12 September 2025 |
91.07 (-2.75%) |
93.13 |
89.70 - 93.24 |
0.8155 times |
Fri 05 September 2025 |
93.65 (6.36%) |
90.64 |
85.31 - 94.07 |
1.9749 times |
Fri 29 August 2025 |
88.05 (0%) |
90.28 |
86.71 - 91.05 |
0.4791 times |
Fri 29 August 2025 |
88.05 (0.82%) |
87.00 |
84.55 - 93.50 |
2.0436 times |
Fri 22 August 2025 |
87.33 (6.53%) |
82.00 |
79.36 - 88.07 |
1.1631 times |
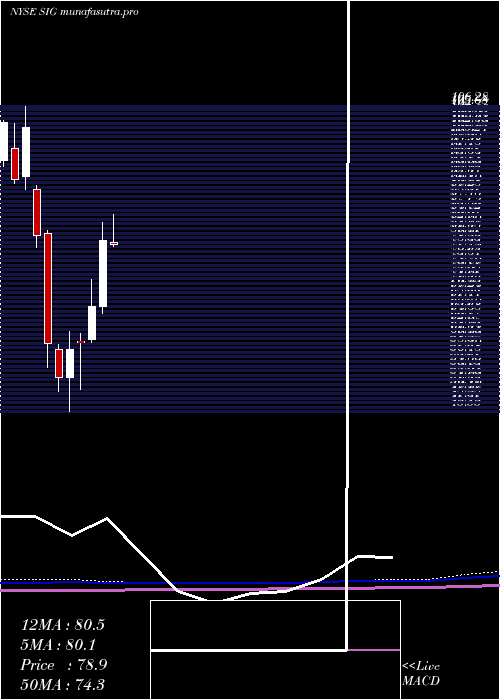
Monthly price and charts SignetJewelers Strong monthly Stock price targets for SignetJewelers SIG are 98.58 and 111.54 | Monthly Target 1 | 87.82 | | Monthly Target 2 | 96.37 | | Monthly Target 3 | 100.78333333333 | | Monthly Target 4 | 109.33 | | Monthly Target 5 | 113.74 |
Monthly price and volumes Signet Jewelers
| Date |
Closing |
Open |
Range |
Volume |
Mon 20 October 2025 |
104.91 (9.37%) |
95.45 |
92.24 - 105.20 |
0.3266 times |
Tue 30 September 2025 |
95.92 (8.94%) |
90.64 |
85.31 - 97.88 |
0.7879 times |
Fri 29 August 2025 |
88.05 (11.31%) |
77.62 |
73.63 - 93.50 |
0.8306 times |
Thu 31 July 2025 |
79.10 (-0.57%) |
79.25 |
77.12 - 88.51 |
0.8557 times |
Mon 30 June 2025 |
79.55 (19.5%) |
66.42 |
65.20 - 83.14 |
1.0567 times |
Fri 30 May 2025 |
66.57 (12.26%) |
59.99 |
59.35 - 71.87 |
0.8238 times |
Wed 30 April 2025 |
59.30 (2.14%) |
59.47 |
49.99 - 61.14 |
1.0431 times |
Mon 31 March 2025 |
58.06 (10.97%) |
52.37 |
45.55 - 61.46 |
1.3882 times |
Fri 28 February 2025 |
52.32 (-11.67%) |
58.00 |
49.68 - 58.94 |
1.1238 times |
Fri 31 January 2025 |
59.23 (-26.61%) |
81.02 |
54.44 - 81.58 |
1.7637 times |
Tue 31 December 2024 |
80.71 (-20.94%) |
89.76 |
78.17 - 90.48 |
0.7237 times |
DMA SMA EMA moving averages of Signet Jewelers SIG
DMA (daily moving average) of Signet Jewelers SIG
| DMA period | DMA value | | 5 day DMA | 103.23 | | 12 day DMA | 99.18 | | 20 day DMA | 97.9 | | 35 day DMA | 95.01 | | 50 day DMA | 91.21 | | 100 day DMA | 84.72 | | 150 day DMA | 75.91 | | 200 day DMA | 71.73 | EMA (exponential moving average) of Signet Jewelers SIG
| EMA period | EMA current | EMA prev | EMA prev2 | | 5 day EMA | 102.82 | 101.78 | 101.05 | | 12 day EMA | 100.18 | 99.32 | 98.61 | | 20 day EMA | 98.11 | 97.39 | 96.77 | | 35 day EMA | 94.49 | 93.88 | 93.33 | | 50 day EMA | 91.24 | 90.68 | 90.17 |
SMA (simple moving average) of Signet Jewelers SIG
| SMA period | SMA current | SMA prev | SMA prev2 | | 5 day SMA | 103.23 | 102.21 | 100.29 | | 12 day SMA | 99.18 | 98.49 | 97.89 | | 20 day SMA | 97.9 | 97.38 | 96.83 | | 35 day SMA | 95.01 | 94.68 | 94.24 | | 50 day SMA | 91.21 | 90.62 | 90.07 | | 100 day SMA | 84.72 | 84.3 | 83.92 | | 150 day SMA | 75.91 | 75.53 | 75.16 | | 200 day SMA | 71.73 | 71.61 | 71.51 |
|
|
