NationalSteel SID full analysis,charts,indicators,moving averages,SMA,DMA,EMA,ADX,MACD,RSINational Steel SID WideScreen charts, DMA,SMA,EMA technical analysis, forecast prediction, by indicators ADX,MACD,RSI,CCI NYSE stock exchange
operates under Capital Goods sector & deals in Steel Iron Ore
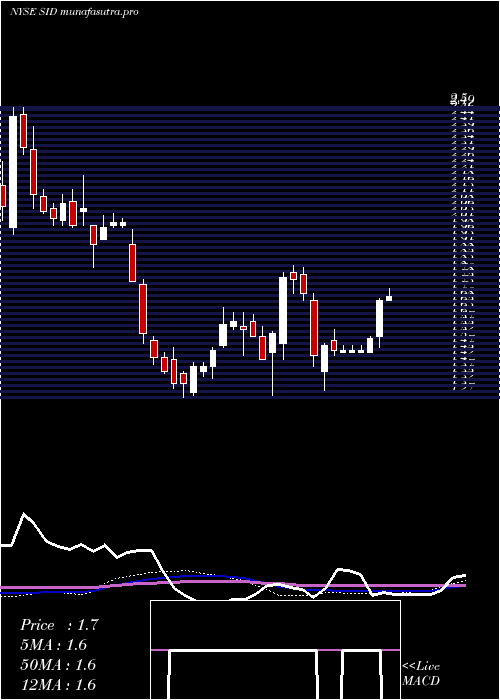
Daily price and charts and targets NationalSteel Strong Daily Stock price targets for NationalSteel SID are 1.61 and 1.71 | Daily Target 1 | 1.53 | | Daily Target 2 | 1.59 | | Daily Target 3 | 1.63 | | Daily Target 4 | 1.69 | | Daily Target 5 | 1.73 |
Daily price and volume National Steel
| Date |
Closing |
Open |
Range |
Volume |
Mon 20 October 2025 |
1.65 (5.77%) |
1.57 |
1.57 - 1.67 |
1.4835 times |
Fri 17 October 2025 |
1.56 (2.63%) |
1.50 |
1.49 - 1.57 |
0.9501 times |
Thu 16 October 2025 |
1.52 (-1.94%) |
1.55 |
1.50 - 1.57 |
1.1886 times |
Wed 15 October 2025 |
1.55 (0.65%) |
1.53 |
1.52 - 1.57 |
0.7422 times |
Tue 14 October 2025 |
1.54 (0%) |
1.51 |
1.51 - 1.56 |
0.5156 times |
Mon 13 October 2025 |
1.54 (-3.75%) |
1.51 |
1.49 - 1.55 |
1.0543 times |
Tue 07 October 2025 |
1.60 (-3.61%) |
1.63 |
1.59 - 1.65 |
0.9463 times |
Mon 06 October 2025 |
1.66 (5.73%) |
1.59 |
1.55 - 1.67 |
2.0426 times |
Fri 03 October 2025 |
1.57 (1.95%) |
1.53 |
1.53 - 1.57 |
0.4809 times |
Thu 02 October 2025 |
1.54 (0%) |
1.56 |
1.49 - 1.56 |
0.5959 times |
Wed 01 October 2025 |
1.54 (2.67%) |
1.52 |
1.52 - 1.56 |
0.6776 times |

Weekly price and charts NationalSteel Strong weekly Stock price targets for NationalSteel SID are 1.61 and 1.71 | Weekly Target 1 | 1.53 | | Weekly Target 2 | 1.59 | | Weekly Target 3 | 1.63 | | Weekly Target 4 | 1.69 | | Weekly Target 5 | 1.73 |
Weekly price and volumes for National Steel
| Date |
Closing |
Open |
Range |
Volume |
Mon 20 October 2025 |
1.65 (5.77%) |
1.57 |
1.57 - 1.67 |
0.5763 times |
Fri 17 October 2025 |
1.56 (-2.5%) |
1.51 |
1.49 - 1.57 |
1.7291 times |
Tue 07 October 2025 |
1.60 (1.91%) |
1.59 |
1.55 - 1.67 |
1.1611 times |
Fri 03 October 2025 |
1.57 (3.97%) |
1.53 |
1.49 - 1.58 |
1.1951 times |
Fri 26 September 2025 |
1.51 (0.67%) |
1.48 |
1.46 - 1.55 |
1.0072 times |
Fri 19 September 2025 |
1.50 (1.35%) |
1.48 |
1.47 - 1.59 |
1.3841 times |
Fri 12 September 2025 |
1.48 (1.37%) |
1.48 |
1.43 - 1.52 |
0.6395 times |
Fri 05 September 2025 |
1.46 (3.55%) |
1.38 |
1.36 - 1.49 |
0.6937 times |
Fri 29 August 2025 |
1.41 (0%) |
1.45 |
1.41 - 1.47 |
0.2937 times |
Fri 29 August 2025 |
1.41 (6.02%) |
1.34 |
1.33 - 1.47 |
1.32 times |
Fri 22 August 2025 |
1.33 (3.91%) |
1.31 |
1.24 - 1.35 |
2.0161 times |
Monthly price and charts NationalSteel Strong monthly Stock price targets for NationalSteel SID are 1.57 and 1.75 | Monthly Target 1 | 1.42 | | Monthly Target 2 | 1.54 | | Monthly Target 3 | 1.6033333333333 | | Monthly Target 4 | 1.72 | | Monthly Target 5 | 1.78 |
Monthly price and volumes National Steel
| Date |
Closing |
Open |
Range |
Volume |
Mon 20 October 2025 |
1.65 (10%) |
1.52 |
1.49 - 1.67 |
0.6545 times |
Tue 30 September 2025 |
1.50 (6.38%) |
1.38 |
1.36 - 1.59 |
0.6687 times |
Fri 29 August 2025 |
1.41 (-2.76%) |
1.44 |
1.24 - 1.47 |
1.1999 times |
Thu 31 July 2025 |
1.45 (3.57%) |
1.39 |
1.36 - 1.62 |
1.448 times |
Mon 30 June 2025 |
1.40 (-3.45%) |
1.47 |
1.31 - 1.57 |
1.004 times |
Fri 30 May 2025 |
1.45 (-13.69%) |
1.70 |
1.45 - 1.74 |
1.6139 times |
Wed 30 April 2025 |
1.68 (0.6%) |
1.68 |
1.30 - 1.74 |
0.7995 times |
Mon 31 March 2025 |
1.67 (16.78%) |
1.46 |
1.28 - 1.83 |
0.9129 times |
Fri 28 February 2025 |
1.43 (-9.49%) |
1.57 |
1.43 - 1.63 |
0.582 times |
Fri 31 January 2025 |
1.58 (9.72%) |
1.40 |
1.27 - 1.65 |
1.1165 times |
Tue 31 December 2024 |
1.44 (-28.36%) |
1.92 |
1.41 - 1.98 |
0.9098 times |

DMA SMA EMA moving averages of National Steel SID
DMA (daily moving average) of National Steel SID
| DMA period | DMA value | | 5 day DMA | 1.56 | | 12 day DMA | 1.56 | | 20 day DMA | 1.54 | | 35 day DMA | 1.51 | | 50 day DMA | 1.46 | | 100 day DMA | 1.47 | | 150 day DMA | 1.52 | | 200 day DMA | 1.51 | EMA (exponential moving average) of National Steel SID
| EMA period | EMA current | EMA prev | EMA prev2 | | 5 day EMA | 1.58 | 1.55 | 1.55 | | 12 day EMA | 1.57 | 1.55 | 1.55 | | 20 day EMA | 1.54 | 1.53 | 1.53 | | 35 day EMA | 1.5 | 1.49 | 1.49 | | 50 day EMA | 1.45 | 1.44 | 1.44 |
SMA (simple moving average) of National Steel SID
| SMA period | SMA current | SMA prev | SMA prev2 | | 5 day SMA | 1.56 | 1.54 | 1.55 | | 12 day SMA | 1.56 | 1.55 | 1.55 | | 20 day SMA | 1.54 | 1.54 | 1.54 | | 35 day SMA | 1.51 | 1.5 | 1.49 | | 50 day SMA | 1.46 | 1.45 | 1.44 | | 100 day SMA | 1.47 | 1.47 | 1.47 | | 150 day SMA | 1.52 | 1.51 | 1.51 | | 200 day SMA | 1.51 | 1.5 | 1.5 |
|
|
