ShinhanFinancial SHG full analysis,charts,indicators,moving averages,SMA,DMA,EMA,ADX,MACD,RSIShinhan Financial SHG WideScreen charts, DMA,SMA,EMA technical analysis, forecast prediction, by indicators ADX,MACD,RSI,CCI NYSE stock exchange
operates under Finance sector & deals in Major Banks
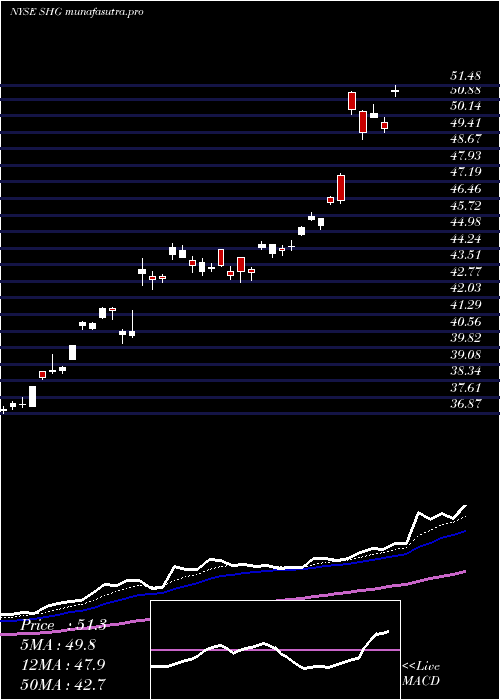
Daily price and charts and targets ShinhanFinancial Strong Daily Stock price targets for ShinhanFinancial SHG are 53.72 and 54.2 | Daily Target 1 | 53.36 | | Daily Target 2 | 53.59 | | Daily Target 3 | 53.84 | | Daily Target 4 | 54.07 | | Daily Target 5 | 54.32 |
Daily price and volume Shinhan Financial
| Date |
Closing |
Open |
Range |
Volume |
Thu 04 December 2025 |
53.82 (-2.57%) |
53.80 |
53.61 - 54.09 |
0.6744 times |
Wed 03 December 2025 |
55.24 (-1.59%) |
55.17 |
54.50 - 55.36 |
0.8635 times |
Tue 02 December 2025 |
56.13 (2.54%) |
55.85 |
55.17 - 56.13 |
1.1975 times |
Mon 01 December 2025 |
54.74 (1.2%) |
54.83 |
54.16 - 55.05 |
0.8523 times |
Fri 28 November 2025 |
54.09 (-0.73%) |
54.20 |
53.85 - 54.32 |
0.6043 times |
Wed 26 November 2025 |
54.49 (1.15%) |
54.51 |
53.90 - 54.62 |
0.9076 times |
Tue 25 November 2025 |
53.87 (0.88%) |
53.64 |
53.26 - 54.07 |
1.2439 times |
Mon 24 November 2025 |
53.40 (1.19%) |
52.19 |
51.96 - 53.40 |
1.5649 times |
Fri 21 November 2025 |
52.77 (2.07%) |
51.81 |
51.71 - 52.94 |
0.8876 times |
Thu 20 November 2025 |
51.70 (-1.8%) |
52.73 |
51.62 - 52.73 |
1.204 times |
Wed 19 November 2025 |
52.65 (-0.53%) |
52.60 |
52.22 - 52.94 |
0.647 times |
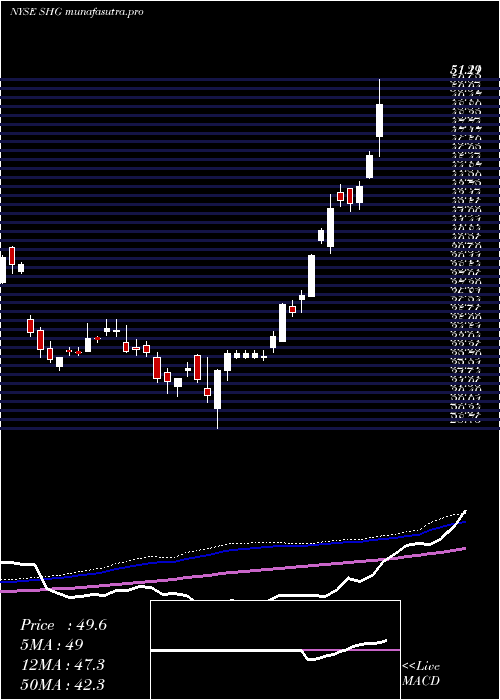
Weekly price and charts ShinhanFinancial Strong weekly Stock price targets for ShinhanFinancial SHG are 52.46 and 54.98 | Weekly Target 1 | 52 | | Weekly Target 2 | 52.91 | | Weekly Target 3 | 54.52 | | Weekly Target 4 | 55.43 | | Weekly Target 5 | 57.04 |
Weekly price and volumes for Shinhan Financial
| Date |
Closing |
Open |
Range |
Volume |
Thu 04 December 2025 |
53.82 (-0.5%) |
54.83 |
53.61 - 56.13 |
0.7721 times |
Fri 28 November 2025 |
54.09 (2.5%) |
52.19 |
51.96 - 54.62 |
0.9298 times |
Fri 21 November 2025 |
52.77 (-4%) |
53.66 |
51.62 - 53.83 |
0.8298 times |
Fri 14 November 2025 |
54.97 (3.23%) |
54.49 |
53.61 - 56.00 |
0.8687 times |
Fri 07 November 2025 |
53.25 (3.02%) |
52.70 |
52.05 - 55.44 |
0.7456 times |
Fri 31 October 2025 |
51.69 (0%) |
51.55 |
51.07 - 51.80 |
0.1624 times |
Fri 31 October 2025 |
51.69 (0.19%) |
52.35 |
50.85 - 53.38 |
1.5085 times |
Fri 24 October 2025 |
51.59 (-1.49%) |
52.75 |
51.25 - 53.42 |
1.0178 times |
Fri 17 October 2025 |
52.37 (6.16%) |
49.71 |
47.05 - 52.58 |
1.3108 times |
Fri 10 October 2025 |
49.33 (-2.59%) |
50.50 |
49.29 - 51.52 |
1.8545 times |
Fri 03 October 2025 |
50.64 (3.49%) |
50.36 |
49.85 - 50.82 |
0.5996 times |
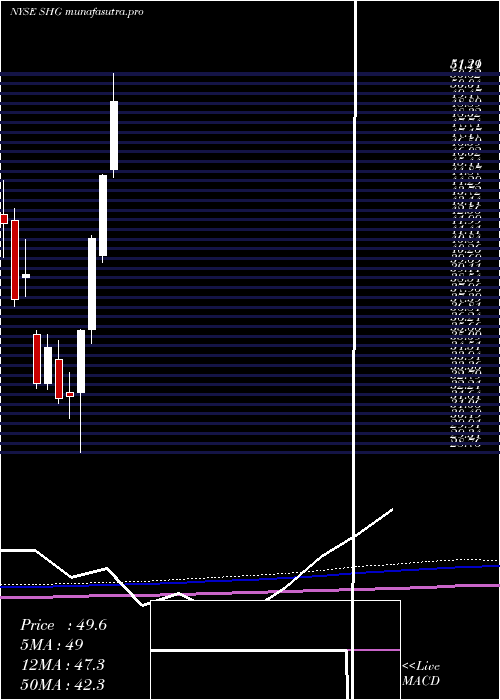
Monthly price and charts ShinhanFinancial Strong monthly Stock price targets for ShinhanFinancial SHG are 52.46 and 54.98 | Monthly Target 1 | 52 | | Monthly Target 2 | 52.91 | | Monthly Target 3 | 54.52 | | Monthly Target 4 | 55.43 | | Monthly Target 5 | 57.04 |
Monthly price and volumes Shinhan Financial
| Date |
Closing |
Open |
Range |
Volume |
Thu 04 December 2025 |
53.82 (-0.5%) |
54.83 |
53.61 - 56.13 |
0.187 times |
Fri 28 November 2025 |
54.09 (4.64%) |
52.70 |
51.62 - 56.00 |
0.817 times |
Fri 31 October 2025 |
51.69 (2.62%) |
50.39 |
47.05 - 53.42 |
1.4981 times |
Tue 30 September 2025 |
50.37 (6.65%) |
46.44 |
46.26 - 50.67 |
1.1405 times |
Fri 29 August 2025 |
47.23 (-3.02%) |
47.00 |
46.47 - 51.00 |
0.7077 times |
Thu 31 July 2025 |
48.70 (7.79%) |
45.53 |
45.07 - 52.00 |
1.4383 times |
Mon 30 June 2025 |
45.18 (8.97%) |
40.42 |
40.02 - 45.23 |
0.8551 times |
Fri 30 May 2025 |
41.46 (15.23%) |
36.06 |
35.24 - 41.60 |
0.884 times |
Wed 30 April 2025 |
35.98 (12.16%) |
32.32 |
28.76 - 36.06 |
1.1301 times |
Mon 31 March 2025 |
32.08 (0.41%) |
32.33 |
30.80 - 33.50 |
1.3423 times |
Fri 28 February 2025 |
31.95 (-8.77%) |
34.28 |
31.68 - 35.39 |
1.5658 times |
DMA SMA EMA moving averages of Shinhan Financial SHG
DMA (daily moving average) of Shinhan Financial SHG
| DMA period | DMA value | | 5 day DMA | 54.8 | | 12 day DMA | 53.82 | | 20 day DMA | 53.99 | | 35 day DMA | 53.21 | | 50 day DMA | 52.28 | | 100 day DMA | 50.6 | | 150 day DMA | 47.78 | | 200 day DMA | 44.01 | EMA (exponential moving average) of Shinhan Financial SHG
| EMA period | EMA current | EMA prev | EMA prev2 | | 5 day EMA | 54.57 | 54.95 | 54.8 | | 12 day EMA | 54.2 | 54.27 | 54.09 | | 20 day EMA | 53.82 | 53.82 | 53.67 | | 35 day EMA | 53.06 | 53.01 | 52.88 | | 50 day EMA | 52.28 | 52.22 | 52.1 |
SMA (simple moving average) of Shinhan Financial SHG
| SMA period | SMA current | SMA prev | SMA prev2 | | 5 day SMA | 54.8 | 54.94 | 54.66 | | 12 day SMA | 53.82 | 53.76 | 53.74 | | 20 day SMA | 53.99 | 53.95 | 53.84 | | 35 day SMA | 53.21 | 53.12 | 52.94 | | 50 day SMA | 52.28 | 52.18 | 52.07 | | 100 day SMA | 50.6 | 50.56 | 50.52 | | 150 day SMA | 47.78 | 47.66 | 47.53 | | 200 day SMA | 44.01 | 43.91 | 43.81 |
|
|
