StifelFinancial SF full analysis,charts,indicators,moving averages,SMA,DMA,EMA,ADX,MACD,RSIStifel Financial SF WideScreen charts, DMA,SMA,EMA technical analysis, forecast prediction, by indicators ADX,MACD,RSI,CCI NYSE stock exchange
operates under Finance sector & deals in Investment Bankers Brokers Service
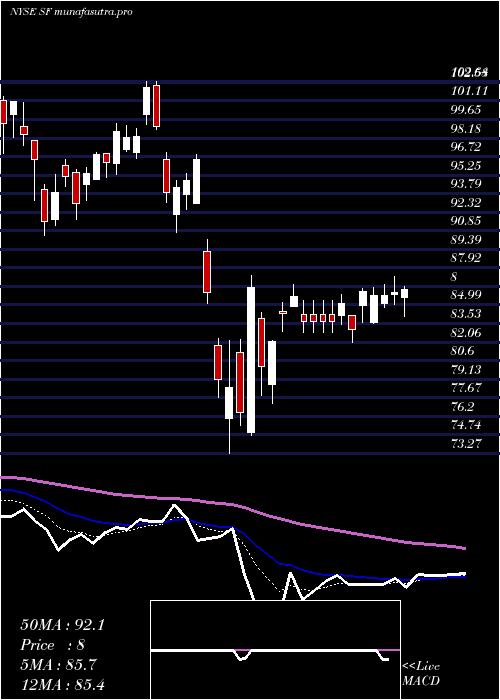
Daily price and charts and targets StifelFinancial Strong Daily Stock price targets for StifelFinancial SF are 123.93 and 126.4 | Daily Target 1 | 122.03 | | Daily Target 2 | 123.36 | | Daily Target 3 | 124.5 | | Daily Target 4 | 125.83 | | Daily Target 5 | 126.97 |
Daily price and volume Stifel Financial
| Date |
Closing |
Open |
Range |
Volume |
Thu 04 December 2025 |
124.69 (1.44%) |
123.71 |
123.17 - 125.64 |
0.9414 times |
Wed 03 December 2025 |
122.92 (2.22%) |
120.38 |
120.38 - 123.23 |
0.704 times |
Tue 02 December 2025 |
120.25 (-0.82%) |
121.94 |
120.21 - 121.97 |
0.5509 times |
Mon 01 December 2025 |
121.24 (-0.62%) |
120.78 |
118.82 - 122.18 |
0.7649 times |
Fri 28 November 2025 |
122.00 (0.69%) |
121.73 |
121.15 - 122.52 |
0.4414 times |
Wed 26 November 2025 |
121.16 (0.47%) |
120.94 |
120.50 - 122.44 |
0.6614 times |
Tue 25 November 2025 |
120.59 (1.71%) |
116.76 |
116.76 - 120.90 |
0.8011 times |
Mon 24 November 2025 |
118.56 (1.37%) |
118.33 |
116.13 - 119.05 |
1.2321 times |
Fri 21 November 2025 |
116.96 (1.49%) |
115.61 |
113.08 - 117.93 |
1.5686 times |
Thu 20 November 2025 |
115.24 (-2.85%) |
121.02 |
115.02 - 122.01 |
2.3341 times |
Wed 19 November 2025 |
118.62 (1.56%) |
117.54 |
116.66 - 118.85 |
1.0779 times |
Weekly price and charts StifelFinancial Strong weekly Stock price targets for StifelFinancial SF are 121.76 and 128.58 | Weekly Target 1 | 116.23 | | Weekly Target 2 | 120.46 | | Weekly Target 3 | 123.05 | | Weekly Target 4 | 127.28 | | Weekly Target 5 | 129.87 |
Weekly price and volumes for Stifel Financial
| Date |
Closing |
Open |
Range |
Volume |
Thu 04 December 2025 |
124.69 (2.2%) |
120.78 |
118.82 - 125.64 |
0.6886 times |
Fri 28 November 2025 |
122.00 (4.31%) |
118.33 |
116.13 - 122.52 |
0.7293 times |
Fri 21 November 2025 |
116.96 (-3.18%) |
120.30 |
113.08 - 122.01 |
1.5662 times |
Fri 14 November 2025 |
120.80 (-0.77%) |
122.68 |
119.21 - 125.73 |
1.3412 times |
Fri 07 November 2025 |
121.74 (2.79%) |
118.04 |
117.24 - 121.74 |
0.7726 times |
Fri 31 October 2025 |
118.43 (0%) |
117.66 |
116.38 - 118.94 |
0.3066 times |
Fri 31 October 2025 |
118.43 (0.42%) |
119.61 |
115.70 - 120.97 |
1.5438 times |
Fri 24 October 2025 |
117.94 (7.02%) |
111.30 |
110.78 - 118.85 |
1.5532 times |
Fri 17 October 2025 |
110.20 (-0.71%) |
108.98 |
107.18 - 113.15 |
1.0744 times |
Tue 07 October 2025 |
110.99 (-0.39%) |
112.00 |
110.53 - 114.50 |
0.424 times |
Fri 03 October 2025 |
111.42 (-2.83%) |
115.32 |
110.54 - 116.00 |
1.2093 times |
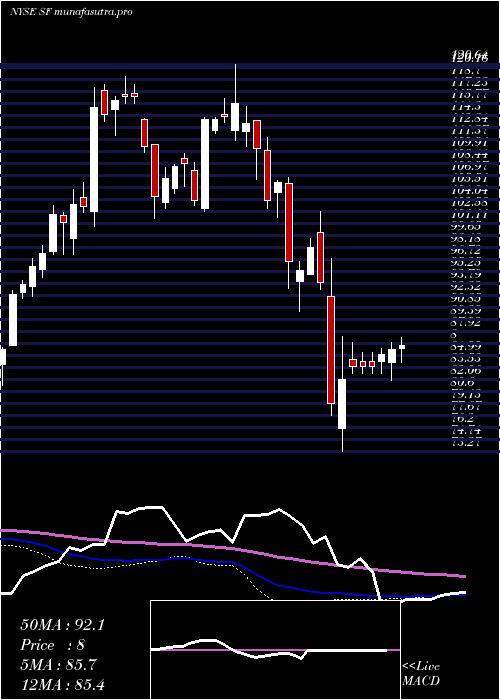
Monthly price and charts StifelFinancial Strong monthly Stock price targets for StifelFinancial SF are 121.76 and 128.58 | Monthly Target 1 | 116.23 | | Monthly Target 2 | 120.46 | | Monthly Target 3 | 123.05 | | Monthly Target 4 | 127.28 | | Monthly Target 5 | 129.87 |
Monthly price and volumes Stifel Financial
| Date |
Closing |
Open |
Range |
Volume |
Thu 04 December 2025 |
124.69 (2.2%) |
120.78 |
118.82 - 125.64 |
0.1412 times |
Fri 28 November 2025 |
122.00 (3.01%) |
118.04 |
113.08 - 125.73 |
0.9038 times |
Fri 31 October 2025 |
118.43 (4.37%) |
112.23 |
107.18 - 120.97 |
1.1465 times |
Tue 30 September 2025 |
113.47 (-1.58%) |
112.93 |
110.78 - 116.42 |
1.1268 times |
Fri 29 August 2025 |
115.29 (1.03%) |
111.64 |
108.43 - 117.49 |
0.9791 times |
Thu 31 July 2025 |
114.12 (9.96%) |
103.22 |
103.22 - 116.75 |
1.1443 times |
Mon 30 June 2025 |
103.78 (10.15%) |
93.60 |
91.81 - 104.91 |
0.8457 times |
Fri 30 May 2025 |
94.22 (9.95%) |
85.70 |
85.40 - 100.40 |
0.9245 times |
Wed 30 April 2025 |
85.69 (-9.09%) |
93.69 |
73.27 - 96.90 |
1.6273 times |
Mon 31 March 2025 |
94.26 (-11.23%) |
106.08 |
90.44 - 106.75 |
1.1609 times |
Fri 28 February 2025 |
106.19 (-8.34%) |
112.44 |
101.83 - 115.39 |
0.8979 times |

DMA SMA EMA moving averages of Stifel Financial SF
DMA (daily moving average) of Stifel Financial SF
| DMA period | DMA value | | 5 day DMA | 122.22 | | 12 day DMA | 119.92 | | 20 day DMA | 120.47 | | 35 day DMA | 118.61 | | 50 day DMA | 116.8 | | 100 day DMA | 114.79 | | 150 day DMA | 108.83 | | 200 day DMA | 105.19 | EMA (exponential moving average) of Stifel Financial SF
| EMA period | EMA current | EMA prev | EMA prev2 | | 5 day EMA | 122.44 | 121.32 | 120.52 | | 12 day EMA | 121.03 | 120.36 | 119.9 | | 20 day EMA | 120.18 | 119.71 | 119.37 | | 35 day EMA | 118.6 | 118.24 | 117.96 | | 50 day EMA | 117.15 | 116.84 | 116.59 |
SMA (simple moving average) of Stifel Financial SF
| SMA period | SMA current | SMA prev | SMA prev2 | | 5 day SMA | 122.22 | 121.51 | 121.05 | | 12 day SMA | 119.92 | 119.22 | 119.04 | | 20 day SMA | 120.47 | 120.21 | 120.03 | | 35 day SMA | 118.61 | 118.25 | 117.91 | | 50 day SMA | 116.8 | 116.6 | 116.46 | | 100 day SMA | 114.79 | 114.64 | 114.49 | | 150 day SMA | 108.83 | 108.58 | 108.33 | | 200 day SMA | 105.19 | 105.11 | 105.03 |
|
|
