SteelcaseInc SCS full analysis,charts,indicators,moving averages,SMA,DMA,EMA,ADX,MACD,RSISteelcase Inc SCS WideScreen charts, DMA,SMA,EMA technical analysis, forecast prediction, by indicators ADX,MACD,RSI,CCI NYSE stock exchange
operates under Consumer Durables sector & deals in Office Equipment Supplies Services
Daily price and charts and targets SteelcaseInc Strong Daily Stock price targets for SteelcaseInc SCS are 16.01 and 16.33 | Daily Target 1 | 15.93 | | Daily Target 2 | 16.08 | | Daily Target 3 | 16.25 | | Daily Target 4 | 16.4 | | Daily Target 5 | 16.57 |
Daily price and volume Steelcase Inc
| Date |
Closing |
Open |
Range |
Volume |
Thu 04 December 2025 |
16.23 (-0.73%) |
16.34 |
16.10 - 16.42 |
0.6183 times |
Wed 03 December 2025 |
16.35 (-0.12%) |
16.40 |
16.34 - 16.52 |
0.7448 times |
Tue 02 December 2025 |
16.37 (-0.06%) |
16.45 |
16.30 - 16.45 |
0.7814 times |
Mon 01 December 2025 |
16.38 (0.55%) |
16.17 |
16.17 - 16.45 |
1.7613 times |
Fri 28 November 2025 |
16.29 (0.56%) |
16.20 |
16.15 - 16.31 |
0.3946 times |
Wed 26 November 2025 |
16.20 (-0.25%) |
16.17 |
16.09 - 16.30 |
0.4155 times |
Tue 25 November 2025 |
16.24 (1.69%) |
15.91 |
15.91 - 16.28 |
0.7019 times |
Mon 24 November 2025 |
15.97 (-0.93%) |
16.15 |
15.89 - 16.15 |
1.8613 times |
Fri 21 November 2025 |
16.12 (2.35%) |
15.86 |
15.81 - 16.17 |
1.9041 times |
Thu 20 November 2025 |
15.75 (0.13%) |
15.91 |
15.67 - 15.91 |
0.8167 times |
Wed 19 November 2025 |
15.73 (0.45%) |
15.64 |
15.58 - 15.78 |
0.4896 times |
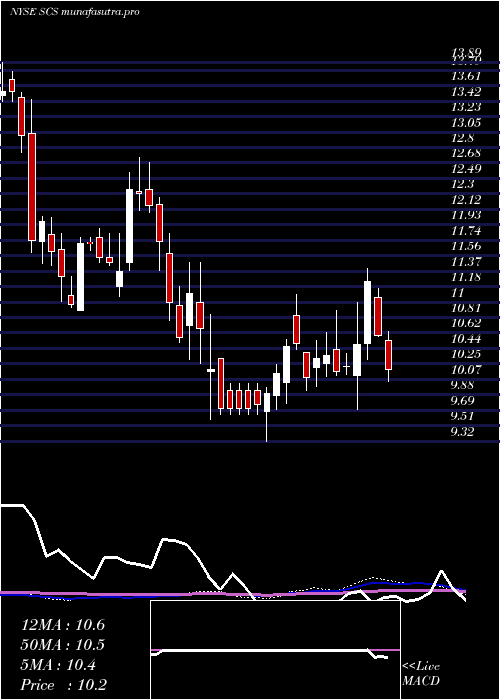
Weekly price and charts SteelcaseInc Strong weekly Stock price targets for SteelcaseInc SCS are 16.17 and 16.59 | Weekly Target 1 | 15.86 | | Weekly Target 2 | 16.05 | | Weekly Target 3 | 16.283333333333 | | Weekly Target 4 | 16.47 | | Weekly Target 5 | 16.7 |
Weekly price and volumes for Steelcase Inc
| Date |
Closing |
Open |
Range |
Volume |
Thu 04 December 2025 |
16.23 (-0.37%) |
16.17 |
16.10 - 16.52 |
1.2333 times |
Fri 28 November 2025 |
16.29 (1.05%) |
16.15 |
15.89 - 16.31 |
1.0652 times |
Fri 21 November 2025 |
16.12 (2.68%) |
15.63 |
15.45 - 16.17 |
1.5249 times |
Fri 14 November 2025 |
15.70 (-0.38%) |
15.78 |
15.52 - 15.87 |
1.1389 times |
Fri 07 November 2025 |
15.76 (-1.25%) |
15.76 |
15.63 - 15.97 |
0.9848 times |
Fri 31 October 2025 |
15.96 (0%) |
15.97 |
15.84 - 16.02 |
0.2376 times |
Fri 31 October 2025 |
15.96 (-4.89%) |
16.87 |
15.84 - 16.87 |
1.6274 times |
Fri 24 October 2025 |
16.78 (1.39%) |
16.55 |
16.55 - 16.90 |
0.7961 times |
Fri 17 October 2025 |
16.55 (-1.84%) |
16.43 |
16.32 - 16.80 |
0.8671 times |
Tue 07 October 2025 |
16.86 (-2.03%) |
16.98 |
16.81 - 17.08 |
0.5247 times |
Fri 03 October 2025 |
17.21 (0.7%) |
17.13 |
16.87 - 17.40 |
1.8764 times |
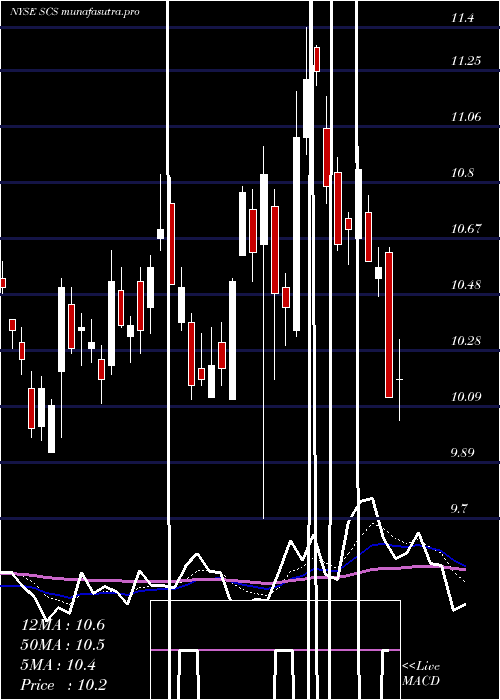
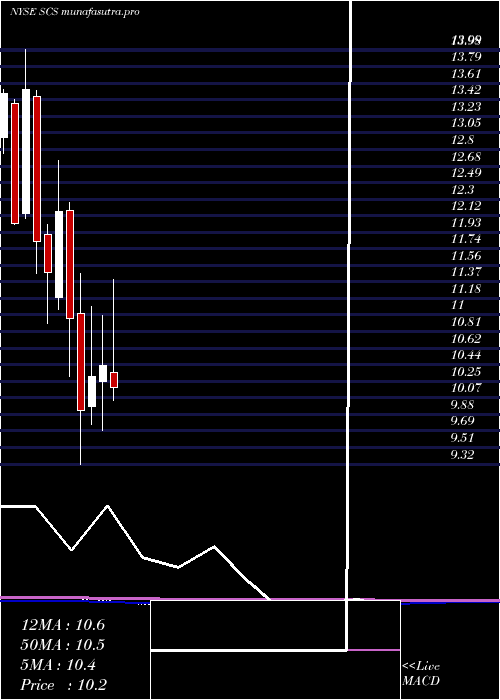
Monthly price and charts SteelcaseInc Strong monthly Stock price targets for SteelcaseInc SCS are 16.17 and 16.59 | Monthly Target 1 | 15.86 | | Monthly Target 2 | 16.05 | | Monthly Target 3 | 16.283333333333 | | Monthly Target 4 | 16.47 | | Monthly Target 5 | 16.7 |
Monthly price and volumes Steelcase Inc
| Date |
Closing |
Open |
Range |
Volume |
Thu 04 December 2025 |
16.23 (-0.37%) |
16.17 |
16.10 - 16.52 |
0.2757 times |
Fri 28 November 2025 |
16.29 (2.07%) |
15.76 |
15.45 - 16.31 |
1.0538 times |
Fri 31 October 2025 |
15.96 (-7.21%) |
17.11 |
15.84 - 17.40 |
1.0994 times |
Tue 30 September 2025 |
17.20 (2.75%) |
16.53 |
16.29 - 17.26 |
1.7297 times |
Fri 29 August 2025 |
16.74 (62.05%) |
10.21 |
10.11 - 16.86 |
2.3087 times |
Thu 31 July 2025 |
10.33 (-0.96%) |
10.35 |
10.04 - 11.40 |
0.831 times |
Mon 30 June 2025 |
10.43 (1.16%) |
10.25 |
9.70 - 10.99 |
0.886 times |
Fri 30 May 2025 |
10.31 (3.93%) |
9.97 |
9.77 - 11.09 |
0.5308 times |
Wed 30 April 2025 |
9.92 (-9.49%) |
11.01 |
9.32 - 11.47 |
0.6549 times |
Mon 31 March 2025 |
10.96 (-9.87%) |
12.18 |
10.30 - 12.26 |
0.63 times |
Fri 28 February 2025 |
12.16 (5.92%) |
11.19 |
11.06 - 12.74 |
0.5082 times |
DMA SMA EMA moving averages of Steelcase Inc SCS
DMA (daily moving average) of Steelcase Inc SCS
| DMA period | DMA value | | 5 day DMA | 16.32 | | 12 day DMA | 16.11 | | 20 day DMA | 15.94 | | 35 day DMA | 16.12 | | 50 day DMA | 16.36 | | 100 day DMA | 15.47 | | 150 day DMA | 13.79 | | 200 day DMA | 13.08 | EMA (exponential moving average) of Steelcase Inc SCS
| EMA period | EMA current | EMA prev | EMA prev2 | | 5 day EMA | 16.28 | 16.3 | 16.27 | | 12 day EMA | 16.16 | 16.15 | 16.11 | | 20 day EMA | 16.12 | 16.11 | 16.09 | | 35 day EMA | 16.23 | 16.23 | 16.22 | | 50 day EMA | 16.4 | 16.41 | 16.41 |
SMA (simple moving average) of Steelcase Inc SCS
| SMA period | SMA current | SMA prev | SMA prev2 | | 5 day SMA | 16.32 | 16.32 | 16.3 | | 12 day SMA | 16.11 | 16.05 | 15.99 | | 20 day SMA | 15.94 | 15.93 | 15.91 | | 35 day SMA | 16.12 | 16.13 | 16.14 | | 50 day SMA | 16.36 | 16.37 | 16.39 | | 100 day SMA | 15.47 | 15.42 | 15.36 | | 150 day SMA | 13.79 | 13.75 | 13.7 | | 200 day SMA | 13.08 | 13.06 | 13.04 |
|
|
