StepanCompany SCL full analysis,charts,indicators,moving averages,SMA,DMA,EMA,ADX,MACD,RSIStepan Company SCL WideScreen charts, DMA,SMA,EMA technical analysis, forecast prediction, by indicators ADX,MACD,RSI,CCI NYSE stock exchange
operates under Basic Industries sector & deals in Package Goods Cosmetics
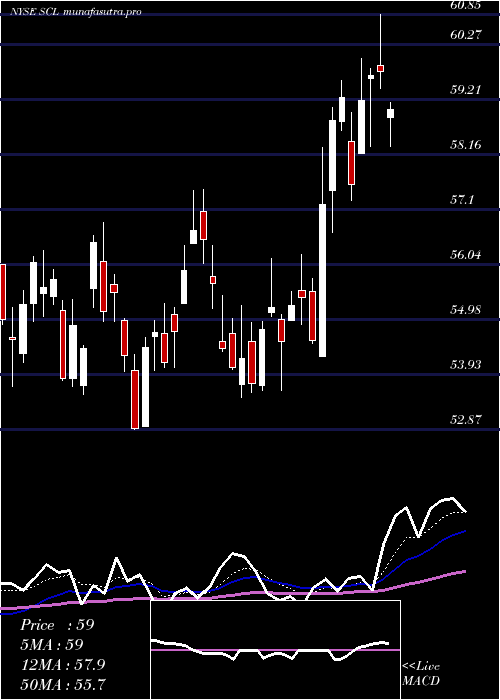
Daily price and charts and targets StepanCompany Strong Daily Stock price targets for StepanCompany SCL are 45.76 and 47.18 | Daily Target 1 | 44.65 | | Daily Target 2 | 45.45 | | Daily Target 3 | 46.066666666667 | | Daily Target 4 | 46.87 | | Daily Target 5 | 47.49 |
Daily price and volume Stepan Company
| Date |
Closing |
Open |
Range |
Volume |
Tue 21 October 2025 |
46.26 (1.51%) |
45.41 |
45.26 - 46.68 |
1.3499 times |
Mon 20 October 2025 |
45.57 (-0.11%) |
45.83 |
45.46 - 46.27 |
1.0562 times |
Fri 17 October 2025 |
45.62 (-1.32%) |
46.01 |
45.60 - 46.49 |
1.0697 times |
Thu 16 October 2025 |
46.23 (-1.85%) |
46.99 |
46.22 - 47.03 |
1.0777 times |
Wed 15 October 2025 |
47.10 (0.32%) |
47.11 |
46.57 - 48.04 |
1.3738 times |
Tue 14 October 2025 |
46.95 (-1.16%) |
46.34 |
46.26 - 47.30 |
1.2512 times |
Mon 13 October 2025 |
47.50 (0.64%) |
47.62 |
47.30 - 48.32 |
0.7569 times |
Fri 10 October 2025 |
47.20 (-1.93%) |
48.21 |
47.10 - 48.90 |
0.694 times |
Thu 09 October 2025 |
48.13 (-1.33%) |
48.70 |
47.90 - 48.91 |
0.62 times |
Wed 08 October 2025 |
48.78 (2.26%) |
47.61 |
47.23 - 48.83 |
0.7506 times |
Tue 07 October 2025 |
47.70 (-1.91%) |
48.49 |
47.68 - 48.49 |
0.9296 times |
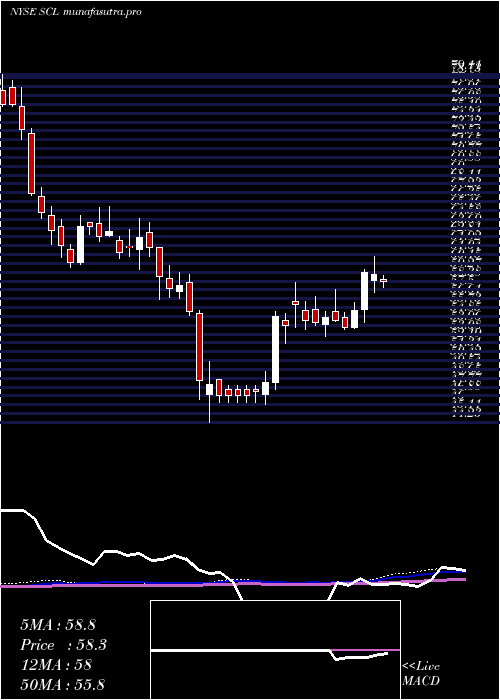
Weekly price and charts StepanCompany Strong weekly Stock price targets for StepanCompany SCL are 45.76 and 47.18 | Weekly Target 1 | 44.65 | | Weekly Target 2 | 45.45 | | Weekly Target 3 | 46.066666666667 | | Weekly Target 4 | 46.87 | | Weekly Target 5 | 47.49 |
Weekly price and volumes for Stepan Company
| Date |
Closing |
Open |
Range |
Volume |
Tue 21 October 2025 |
46.26 (1.4%) |
45.83 |
45.26 - 46.68 |
0.4249 times |
Fri 17 October 2025 |
45.62 (-3.35%) |
47.62 |
45.60 - 48.32 |
0.9765 times |
Fri 10 October 2025 |
47.20 (-3.93%) |
49.23 |
47.10 - 49.67 |
0.6134 times |
Fri 03 October 2025 |
49.13 (4.02%) |
47.30 |
46.40 - 50.09 |
0.8524 times |
Fri 26 September 2025 |
47.23 (-2.74%) |
48.17 |
46.43 - 48.99 |
1.0801 times |
Fri 19 September 2025 |
48.56 (0.94%) |
48.34 |
47.69 - 50.77 |
1.5275 times |
Fri 12 September 2025 |
48.11 (-4.07%) |
50.17 |
47.77 - 50.17 |
0.8992 times |
Fri 05 September 2025 |
50.15 (0.24%) |
49.38 |
48.04 - 50.89 |
0.8674 times |
Fri 29 August 2025 |
50.03 (0%) |
50.20 |
49.62 - 50.35 |
0.2085 times |
Fri 29 August 2025 |
50.03 (-3.58%) |
51.68 |
49.62 - 52.03 |
2.5501 times |
Fri 22 August 2025 |
51.89 (5.15%) |
49.08 |
48.46 - 52.30 |
0.9453 times |
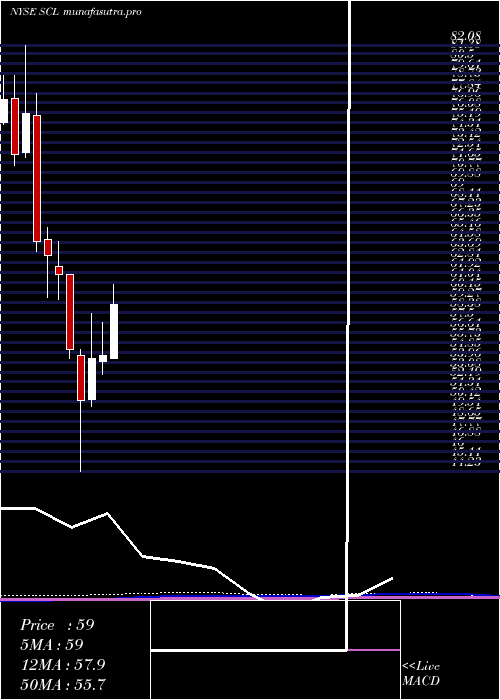
Monthly price and charts StepanCompany Strong monthly Stock price targets for StepanCompany SCL are 43.35 and 48.18 | Monthly Target 1 | 42.37 | | Monthly Target 2 | 44.32 | | Monthly Target 3 | 47.203333333333 | | Monthly Target 4 | 49.15 | | Monthly Target 5 | 52.03 |
Monthly price and volumes Stepan Company
| Date |
Closing |
Open |
Range |
Volume |
Tue 21 October 2025 |
46.26 (-3.02%) |
47.50 |
45.26 - 50.09 |
0.6619 times |
Tue 30 September 2025 |
47.70 (-4.66%) |
49.38 |
46.40 - 50.89 |
1.2689 times |
Fri 29 August 2025 |
50.03 (-1.46%) |
50.16 |
47.97 - 52.30 |
1.4075 times |
Thu 31 July 2025 |
50.77 (-6.98%) |
54.28 |
47.94 - 60.85 |
0.8399 times |
Mon 30 June 2025 |
54.58 (0.53%) |
54.01 |
52.87 - 57.49 |
0.6994 times |
Fri 30 May 2025 |
54.29 (7.38%) |
50.60 |
50.00 - 58.24 |
1.1308 times |
Wed 30 April 2025 |
50.56 (-8.14%) |
54.51 |
44.23 - 55.03 |
1.0649 times |
Mon 31 March 2025 |
55.04 (-10.88%) |
61.72 |
54.31 - 61.72 |
1.0024 times |
Fri 28 February 2025 |
61.76 (-2.57%) |
62.40 |
59.55 - 64.67 |
0.832 times |
Fri 31 January 2025 |
63.39 (-2.02%) |
64.80 |
59.70 - 65.90 |
1.0924 times |
Tue 31 December 2024 |
64.70 (-14.89%) |
75.81 |
63.77 - 77.76 |
0.6724 times |
DMA SMA EMA moving averages of Stepan Company SCL
DMA (daily moving average) of Stepan Company SCL
| DMA period | DMA value | | 5 day DMA | 46.16 | | 12 day DMA | 47.14 | | 20 day DMA | 47.38 | | 35 day DMA | 48 | | 50 day DMA | 48.64 | | 100 day DMA | 51.84 | | 150 day DMA | 51.95 | | 200 day DMA | 54.37 | EMA (exponential moving average) of Stepan Company SCL
| EMA period | EMA current | EMA prev | EMA prev2 | | 5 day EMA | 46.23 | 46.21 | 46.53 | | 12 day EMA | 46.84 | 46.95 | 47.2 | | 20 day EMA | 47.28 | 47.39 | 47.58 | | 35 day EMA | 47.92 | 48.02 | 48.16 | | 50 day EMA | 48.45 | 48.54 | 48.66 |
SMA (simple moving average) of Stepan Company SCL
| SMA period | SMA current | SMA prev | SMA prev2 | | 5 day SMA | 46.16 | 46.29 | 46.68 | | 12 day SMA | 47.14 | 47.38 | 47.65 | | 20 day SMA | 47.38 | 47.42 | 47.54 | | 35 day SMA | 48 | 48.08 | 48.21 | | 50 day SMA | 48.64 | 48.72 | 48.78 | | 100 day SMA | 51.84 | 51.93 | 52.04 | | 150 day SMA | 51.95 | 52.03 | 52.11 | | 200 day SMA | 54.37 | 54.45 | 54.54 |
|
|
