CharlesSchwab SCHW full analysis,charts,indicators,moving averages,SMA,DMA,EMA,ADX,MACD,RSICharles Schwab SCHW WideScreen charts, DMA,SMA,EMA technical analysis, forecast prediction, by indicators ADX,MACD,RSI,CCI NYSE stock exchange
operates under Finance sector & deals in Investment Bankers Brokers Service
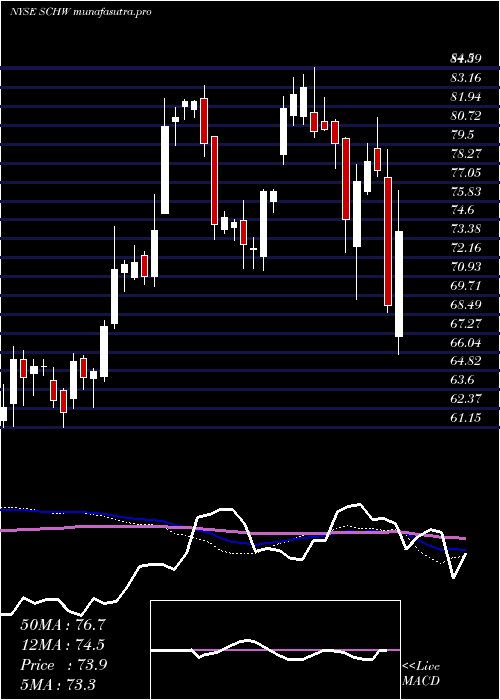
Daily price and charts and targets CharlesSchwab Strong Daily Stock price targets for CharlesSchwab SCHW are 92.89 and 94.72 | Daily Target 1 | 92.58 | | Daily Target 2 | 93.2 | | Daily Target 3 | 94.41 | | Daily Target 4 | 95.03 | | Daily Target 5 | 96.24 |
Daily price and volume Charles Schwab
| Date |
Closing |
Open |
Range |
Volume |
Fri 05 December 2025 |
93.82 (-1.3%) |
94.70 |
93.79 - 95.62 |
1.1035 times |
Thu 04 December 2025 |
95.06 (1.14%) |
94.00 |
93.80 - 95.41 |
0.4894 times |
Wed 03 December 2025 |
93.99 (2.09%) |
92.02 |
91.60 - 94.02 |
1.1823 times |
Tue 02 December 2025 |
92.07 (-0.67%) |
92.80 |
92.03 - 93.12 |
1.2948 times |
Mon 01 December 2025 |
92.69 (-0.04%) |
92.03 |
91.82 - 93.21 |
0.9731 times |
Fri 28 November 2025 |
92.73 (1.01%) |
91.85 |
91.58 - 93.24 |
0.8185 times |
Wed 26 November 2025 |
91.80 (1.17%) |
91.00 |
90.94 - 92.37 |
0.8173 times |
Tue 25 November 2025 |
90.74 (0.24%) |
90.29 |
89.50 - 91.14 |
1.0958 times |
Mon 24 November 2025 |
90.52 (0.01%) |
90.65 |
89.64 - 90.89 |
1.2162 times |
Fri 21 November 2025 |
90.51 (0.02%) |
90.99 |
89.35 - 91.20 |
1.0092 times |
Thu 20 November 2025 |
90.49 (-2.32%) |
93.59 |
90.46 - 94.39 |
1.7362 times |

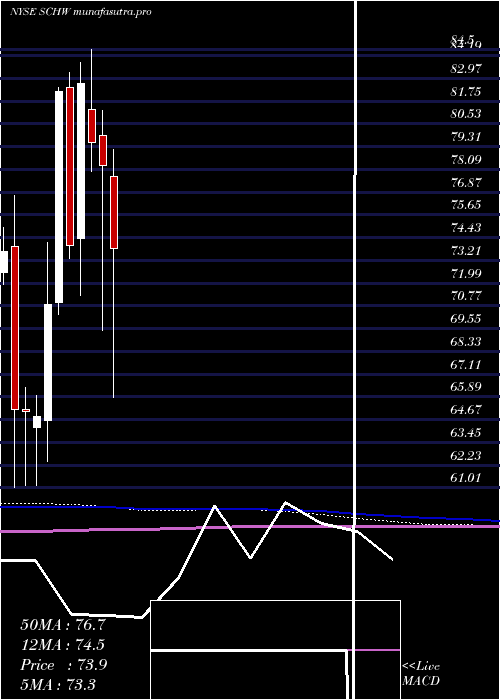
Weekly price and charts CharlesSchwab Strong weekly Stock price targets for CharlesSchwab SCHW are 92.71 and 96.73 | Weekly Target 1 | 89.66 | | Weekly Target 2 | 91.74 | | Weekly Target 3 | 93.68 | | Weekly Target 4 | 95.76 | | Weekly Target 5 | 97.7 |
Weekly price and volumes for Charles Schwab
| Date |
Closing |
Open |
Range |
Volume |
Fri 05 December 2025 |
93.82 (1.18%) |
92.03 |
91.60 - 95.62 |
1.2858 times |
Fri 28 November 2025 |
92.73 (2.45%) |
90.65 |
89.50 - 93.24 |
1.0065 times |
Fri 21 November 2025 |
90.51 (-4.11%) |
94.56 |
89.35 - 94.58 |
1.3234 times |
Fri 14 November 2025 |
94.39 (-0.91%) |
94.90 |
93.34 - 98.50 |
1.1734 times |
Fri 07 November 2025 |
95.26 (0.78%) |
92.80 |
92.13 - 95.49 |
0.6611 times |
Fri 31 October 2025 |
94.52 (0%) |
94.02 |
93.11 - 94.83 |
0.1952 times |
Fri 31 October 2025 |
94.52 (0.12%) |
95.00 |
93.11 - 95.53 |
1.1961 times |
Fri 24 October 2025 |
94.41 (0.29%) |
94.74 |
93.63 - 95.76 |
0.9073 times |
Fri 17 October 2025 |
94.14 (0.14%) |
92.38 |
91.98 - 97.16 |
1.864 times |
Tue 07 October 2025 |
94.01 (-0.15%) |
94.08 |
93.03 - 95.09 |
0.3871 times |
Fri 03 October 2025 |
94.15 (-1.37%) |
95.76 |
92.13 - 97.30 |
1.2225 times |
Monthly price and charts CharlesSchwab Strong monthly Stock price targets for CharlesSchwab SCHW are 92.71 and 96.73 | Monthly Target 1 | 89.66 | | Monthly Target 2 | 91.74 | | Monthly Target 3 | 93.68 | | Monthly Target 4 | 95.76 | | Monthly Target 5 | 97.7 |
Monthly price and volumes Charles Schwab
| Date |
Closing |
Open |
Range |
Volume |
Fri 05 December 2025 |
93.82 (1.18%) |
92.03 |
91.60 - 95.62 |
0.2458 times |
Fri 28 November 2025 |
92.73 (-1.89%) |
92.80 |
89.35 - 98.50 |
0.7961 times |
Fri 31 October 2025 |
94.52 (-1%) |
94.60 |
91.98 - 97.16 |
1.0026 times |
Tue 30 September 2025 |
95.47 (-0.39%) |
95.35 |
90.50 - 97.74 |
1.2863 times |
Fri 29 August 2025 |
95.84 (-1.93%) |
96.23 |
94.35 - 99.42 |
0.9894 times |
Thu 31 July 2025 |
97.73 (7.11%) |
90.92 |
89.95 - 99.59 |
1.1477 times |
Mon 30 June 2025 |
91.24 (3.28%) |
87.76 |
85.76 - 91.36 |
0.8574 times |
Fri 30 May 2025 |
88.34 (8.53%) |
81.13 |
80.98 - 89.85 |
0.9563 times |
Wed 30 April 2025 |
81.40 (3.99%) |
77.71 |
65.88 - 81.66 |
1.523 times |
Mon 31 March 2025 |
78.28 (-1.57%) |
79.89 |
69.46 - 81.24 |
1.1954 times |
Fri 28 February 2025 |
79.53 (-3.86%) |
81.29 |
77.96 - 84.50 |
1.739 times |
DMA SMA EMA moving averages of Charles Schwab SCHW
DMA (daily moving average) of Charles Schwab SCHW
| DMA period | DMA value | | 5 day DMA | 93.53 | | 12 day DMA | 92.26 | | 20 day DMA | 93.28 | | 35 day DMA | 93.76 | | 50 day DMA | 93.84 | | 100 day DMA | 94.61 | | 150 day DMA | 92.39 | | 200 day DMA | 88.56 | EMA (exponential moving average) of Charles Schwab SCHW
| EMA period | EMA current | EMA prev | EMA prev2 | | 5 day EMA | 93.61 | 93.5 | 92.72 | | 12 day EMA | 93.1 | 92.97 | 92.59 | | 20 day EMA | 93.18 | 93.11 | 92.9 | | 35 day EMA | 93.38 | 93.35 | 93.25 | | 50 day EMA | 93.74 | 93.74 | 93.69 |
SMA (simple moving average) of Charles Schwab SCHW
| SMA period | SMA current | SMA prev | SMA prev2 | | 5 day SMA | 93.53 | 93.31 | 92.66 | | 12 day SMA | 92.26 | 92.13 | 91.87 | | 20 day SMA | 93.28 | 93.3 | 93.24 | | 35 day SMA | 93.76 | 93.75 | 93.73 | | 50 day SMA | 93.84 | 93.85 | 93.83 | | 100 day SMA | 94.61 | 94.59 | 94.57 | | 150 day SMA | 92.39 | 92.29 | 92.19 | | 200 day SMA | 88.56 | 88.5 | 88.44 |
|
|
