SibanyeGold SBSW full analysis,charts,indicators,moving averages,SMA,DMA,EMA,ADX,MACD,RSISibanye Gold SBSW WideScreen charts, DMA,SMA,EMA technical analysis, forecast prediction, by indicators ADX,MACD,RSI,CCI NYSE stock exchange
Daily price and charts and targets SibanyeGold Strong Daily Stock price targets for SibanyeGold SBSW are 11.34 and 12.04 | Daily Target 1 | 10.78 | | Daily Target 2 | 11.2 | | Daily Target 3 | 11.483333333333 | | Daily Target 4 | 11.9 | | Daily Target 5 | 12.18 |
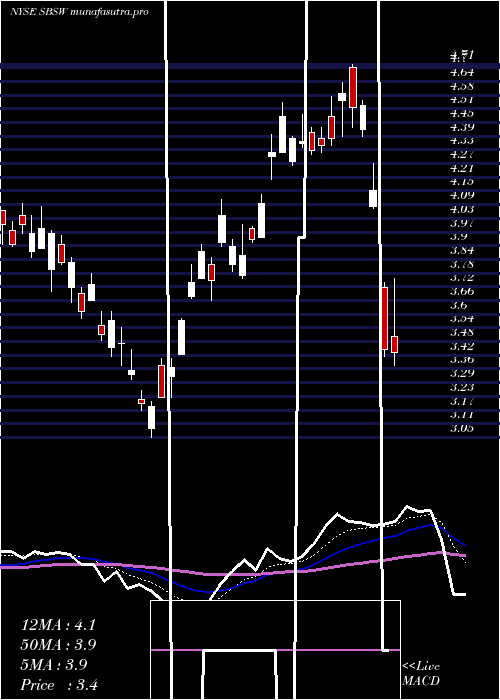
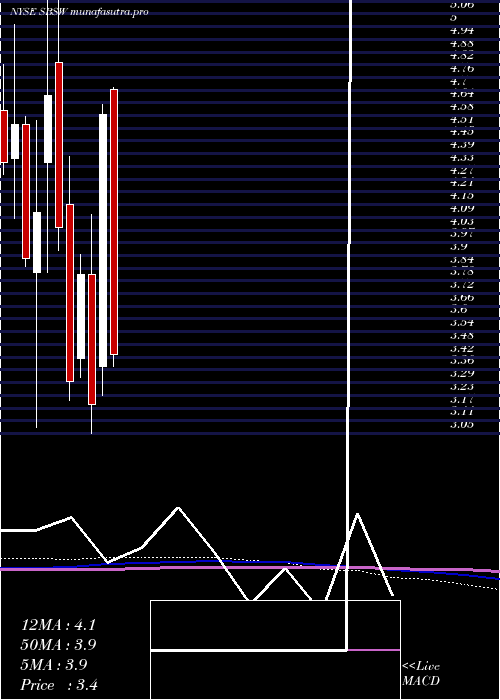
Daily price and volume Sibanye Gold
| Date |
Closing |
Open |
Range |
Volume |
Mon 20 October 2025 |
11.61 (1.4%) |
11.32 |
11.07 - 11.77 |
0.5834 times |
Fri 17 October 2025 |
11.45 (-11.99%) |
12.58 |
11.07 - 12.99 |
1.3775 times |
Thu 16 October 2025 |
13.01 (7.61%) |
12.06 |
12.04 - 13.11 |
1.4012 times |
Wed 15 October 2025 |
12.09 (3.16%) |
11.96 |
11.79 - 12.16 |
0.6837 times |
Tue 14 October 2025 |
11.72 (-0.59%) |
11.41 |
11.38 - 11.96 |
0.6958 times |
Mon 13 October 2025 |
11.79 (7.67%) |
11.80 |
11.52 - 11.93 |
0.8572 times |
Fri 10 October 2025 |
10.95 (-2.14%) |
11.18 |
10.90 - 11.51 |
1.071 times |
Thu 09 October 2025 |
11.19 (-7.52%) |
12.29 |
10.95 - 12.30 |
1.2461 times |
Wed 08 October 2025 |
12.10 (5.49%) |
12.02 |
11.80 - 12.37 |
1.1471 times |
Tue 07 October 2025 |
11.47 (-0.17%) |
11.78 |
11.37 - 11.86 |
0.9368 times |
Mon 06 October 2025 |
11.49 (2.22%) |
11.58 |
11.24 - 11.68 |
0.6857 times |
Weekly price and charts SibanyeGold Strong weekly Stock price targets for SibanyeGold SBSW are 11.34 and 12.04 | Weekly Target 1 | 10.78 | | Weekly Target 2 | 11.2 | | Weekly Target 3 | 11.483333333333 | | Weekly Target 4 | 11.9 | | Weekly Target 5 | 12.18 |
Weekly price and volumes for Sibanye Gold
| Date |
Closing |
Open |
Range |
Volume |
Mon 20 October 2025 |
11.61 (1.4%) |
11.32 |
11.07 - 11.77 |
0.1546 times |
Fri 17 October 2025 |
11.45 (4.57%) |
11.80 |
11.07 - 13.11 |
1.329 times |
Fri 10 October 2025 |
10.95 (-2.58%) |
11.58 |
10.90 - 12.37 |
1.3478 times |
Fri 03 October 2025 |
11.24 (0.72%) |
11.35 |
10.99 - 12.05 |
1.1919 times |
Fri 26 September 2025 |
11.16 (16.98%) |
9.90 |
9.67 - 11.25 |
1.4811 times |
Fri 19 September 2025 |
9.54 (9.4%) |
8.65 |
8.48 - 9.54 |
0.8648 times |
Fri 12 September 2025 |
8.72 (1.51%) |
9.03 |
8.44 - 9.12 |
0.9624 times |
Fri 05 September 2025 |
8.59 (13.47%) |
8.20 |
8.03 - 8.91 |
1.2495 times |
Fri 29 August 2025 |
7.57 (0%) |
7.39 |
7.36 - 7.60 |
0.1981 times |
Fri 29 August 2025 |
7.57 (-9.12%) |
8.32 |
7.10 - 8.50 |
1.2207 times |
Fri 22 August 2025 |
8.33 (2.84%) |
8.19 |
7.81 - 8.42 |
0.6999 times |

Monthly price and charts SibanyeGold Strong monthly Stock price targets for SibanyeGold SBSW are 10.15 and 12.36 | Monthly Target 1 | 9.66 | | Monthly Target 2 | 10.64 | | Monthly Target 3 | 11.873333333333 | | Monthly Target 4 | 12.85 | | Monthly Target 5 | 14.08 |
Monthly price and volumes Sibanye Gold
| Date |
Closing |
Open |
Range |
Volume |
Mon 20 October 2025 |
11.61 (3.29%) |
11.75 |
10.90 - 13.11 |
0.6966 times |
Tue 30 September 2025 |
11.24 (48.48%) |
8.20 |
8.03 - 11.53 |
1.0128 times |
Fri 29 August 2025 |
7.57 (-9.45%) |
8.41 |
7.10 - 9.14 |
0.8095 times |
Thu 31 July 2025 |
8.36 (15.79%) |
7.49 |
7.26 - 9.85 |
1.0907 times |
Mon 30 June 2025 |
7.22 (18.56%) |
6.22 |
5.98 - 7.56 |
1.3085 times |
Fri 30 May 2025 |
6.09 (30.97%) |
4.52 |
4.43 - 6.27 |
1.1827 times |
Wed 30 April 2025 |
4.65 (1.53%) |
4.70 |
3.18 - 5.24 |
1.3649 times |
Mon 31 March 2025 |
4.58 (43.57%) |
3.37 |
3.23 - 4.63 |
0.9617 times |
Fri 28 February 2025 |
3.19 (-16.27%) |
3.81 |
3.05 - 4.10 |
0.8531 times |
Fri 31 January 2025 |
3.81 (15.45%) |
3.41 |
3.32 - 3.91 |
0.7195 times |
Tue 31 December 2024 |
3.30 (-18.32%) |
4.15 |
3.21 - 4.38 |
0.4851 times |
DMA SMA EMA moving averages of Sibanye Gold SBSW
DMA (daily moving average) of Sibanye Gold SBSW
| DMA period | DMA value | | 5 day DMA | 11.98 | | 12 day DMA | 11.68 | | 20 day DMA | 11.39 | | 35 day DMA | 10.27 | | 50 day DMA | 9.61 | | 100 day DMA | 8.69 | | 150 day DMA | 7.34 | | 200 day DMA | 6.42 | EMA (exponential moving average) of Sibanye Gold SBSW
| EMA period | EMA current | EMA prev | EMA prev2 | | 5 day EMA | 11.82 | 11.92 | 12.16 | | 12 day EMA | 11.62 | 11.62 | 11.65 | | 20 day EMA | 11.23 | 11.19 | 11.16 | | 35 day EMA | 10.55 | 10.49 | 10.43 | | 50 day EMA | 9.78 | 9.71 | 9.64 |
SMA (simple moving average) of Sibanye Gold SBSW
| SMA period | SMA current | SMA prev | SMA prev2 | | 5 day SMA | 11.98 | 12.01 | 11.91 | | 12 day SMA | 11.68 | 11.66 | 11.66 | | 20 day SMA | 11.39 | 11.31 | 11.22 | | 35 day SMA | 10.27 | 10.15 | 10.04 | | 50 day SMA | 9.61 | 9.55 | 9.5 | | 100 day SMA | 8.69 | 8.63 | 8.58 | | 150 day SMA | 7.34 | 7.29 | 7.24 | | 200 day SMA | 6.42 | 6.38 | 6.34 |
|
|
