WesternAsset SBI full analysis,charts,indicators,moving averages,SMA,DMA,EMA,ADX,MACD,RSIWestern Asset SBI WideScreen charts, DMA,SMA,EMA technical analysis, forecast prediction, by indicators ADX,MACD,RSI,CCI NYSE stock exchange
operates under N A sector & deals in N A
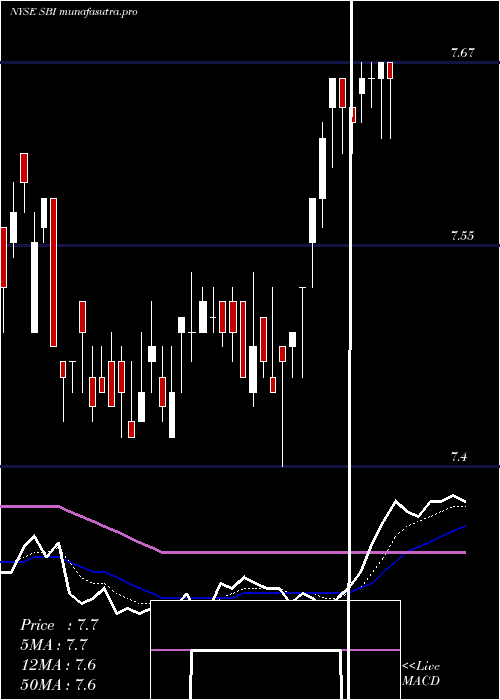
Daily price and charts and targets WesternAsset Strong Daily Stock price targets for WesternAsset SBI are 7.85 and 7.9 | Daily Target 1 | 7.81 | | Daily Target 2 | 7.84 | | Daily Target 3 | 7.86 | | Daily Target 4 | 7.89 | | Daily Target 5 | 7.91 |
Daily price and volume Western Asset
| Date |
Closing |
Open |
Range |
Volume |
Tue 21 October 2025 |
7.87 (0.25%) |
7.86 |
7.83 - 7.88 |
1.0131 times |
Mon 20 October 2025 |
7.85 (0%) |
7.87 |
7.83 - 7.89 |
0.9082 times |
Fri 17 October 2025 |
7.85 (0.13%) |
7.87 |
7.79 - 7.89 |
1.2496 times |
Thu 16 October 2025 |
7.84 (-0.51%) |
7.90 |
7.83 - 7.92 |
1.0789 times |
Wed 15 October 2025 |
7.88 (-0.25%) |
7.93 |
7.87 - 7.99 |
1.4234 times |
Tue 14 October 2025 |
7.90 (-0.25%) |
7.90 |
7.90 - 7.98 |
1.2543 times |
Mon 13 October 2025 |
7.92 (-0.63%) |
7.95 |
7.92 - 7.97 |
0.2787 times |
Tue 07 October 2025 |
7.97 (1.4%) |
7.87 |
7.87 - 7.99 |
1.3451 times |
Mon 06 October 2025 |
7.86 (-0.63%) |
7.86 |
7.86 - 7.93 |
0.448 times |
Fri 03 October 2025 |
7.91 (-0.13%) |
7.90 |
7.90 - 7.97 |
1.0006 times |
Thu 02 October 2025 |
7.92 (-0.5%) |
7.98 |
7.90 - 7.98 |
0.2939 times |
Weekly price and charts WesternAsset Strong weekly Stock price targets for WesternAsset SBI are 7.84 and 7.9 | Weekly Target 1 | 7.8 | | Weekly Target 2 | 7.84 | | Weekly Target 3 | 7.8633333333333 | | Weekly Target 4 | 7.9 | | Weekly Target 5 | 7.92 |
Weekly price and volumes for Western Asset
| Date |
Closing |
Open |
Range |
Volume |
Tue 21 October 2025 |
7.87 (0.25%) |
7.87 |
7.83 - 7.89 |
0.6582 times |
Fri 17 October 2025 |
7.85 (-1.51%) |
7.95 |
7.79 - 7.99 |
1.8105 times |
Tue 07 October 2025 |
7.97 (0.76%) |
7.86 |
7.86 - 7.99 |
0.6143 times |
Fri 03 October 2025 |
7.91 (0.51%) |
7.86 |
7.86 - 7.99 |
0.967 times |
Fri 26 September 2025 |
7.87 (-0.13%) |
7.90 |
7.79 - 7.93 |
1.0337 times |
Fri 19 September 2025 |
7.88 (-0.38%) |
7.91 |
7.84 - 7.95 |
1.4001 times |
Fri 12 September 2025 |
7.91 (2.33%) |
7.73 |
7.73 - 7.92 |
1.6152 times |
Fri 05 September 2025 |
7.73 (1.18%) |
7.65 |
7.62 - 7.74 |
0.6936 times |
Fri 29 August 2025 |
7.64 (0%) |
7.65 |
7.60 - 7.67 |
0.2553 times |
Fri 29 August 2025 |
7.64 (0.53%) |
7.62 |
7.60 - 7.68 |
0.9522 times |
Fri 22 August 2025 |
7.60 (-0.91%) |
7.65 |
7.51 - 7.69 |
1.1474 times |
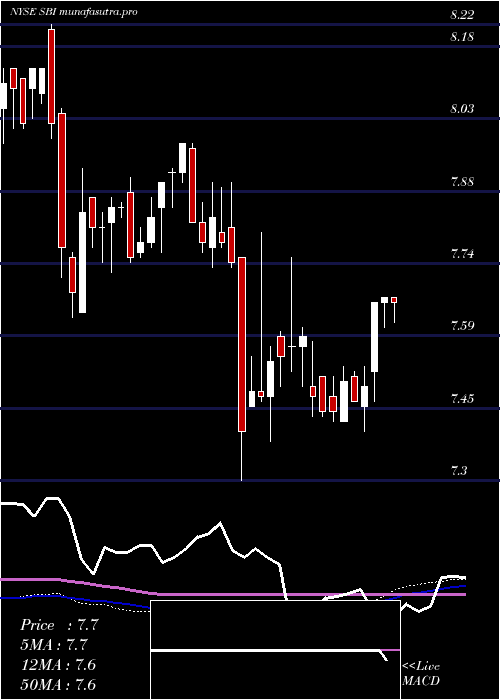
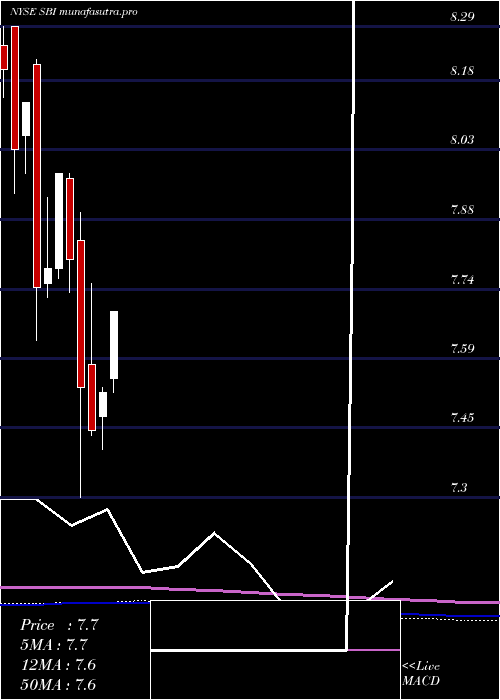
Monthly price and charts WesternAsset Strong monthly Stock price targets for WesternAsset SBI are 7.73 and 7.93 | Monthly Target 1 | 7.68 | | Monthly Target 2 | 7.78 | | Monthly Target 3 | 7.8833333333333 | | Monthly Target 4 | 7.98 | | Monthly Target 5 | 8.08 |
Monthly price and volumes Western Asset
| Date |
Closing |
Open |
Range |
Volume |
Tue 21 October 2025 |
7.87 (-0.51%) |
7.93 |
7.79 - 7.99 |
0.6625 times |
Tue 30 September 2025 |
7.91 (3.53%) |
7.65 |
7.62 - 7.95 |
0.9022 times |
Fri 29 August 2025 |
7.64 (1.06%) |
7.60 |
7.51 - 7.70 |
0.8825 times |
Thu 31 July 2025 |
7.56 (0.53%) |
7.55 |
7.52 - 7.71 |
0.814 times |
Mon 30 June 2025 |
7.52 (1.08%) |
7.47 |
7.40 - 7.53 |
1.3889 times |
Fri 30 May 2025 |
7.44 (-1.2%) |
7.58 |
7.43 - 7.75 |
1.3657 times |
Wed 30 April 2025 |
7.53 (-3.46%) |
7.84 |
7.30 - 7.90 |
1.1313 times |
Mon 31 March 2025 |
7.80 (-2.26%) |
7.97 |
7.73 - 7.98 |
0.745 times |
Fri 28 February 2025 |
7.98 (2.57%) |
7.78 |
7.76 - 7.98 |
1.1424 times |
Fri 31 January 2025 |
7.78 (0.52%) |
7.75 |
7.72 - 7.93 |
0.9656 times |
Tue 31 December 2024 |
7.74 (-4.8%) |
8.21 |
7.63 - 8.22 |
1.1278 times |
DMA SMA EMA moving averages of Western Asset SBI
DMA (daily moving average) of Western Asset SBI
| DMA period | DMA value | | 5 day DMA | 7.86 | | 12 day DMA | 7.89 | | 20 day DMA | 7.89 | | 35 day DMA | 7.85 | | 50 day DMA | 7.79 | | 100 day DMA | 7.67 | | 150 day DMA | 7.65 | | 200 day DMA | 7.7 | EMA (exponential moving average) of Western Asset SBI
| EMA period | EMA current | EMA prev | EMA prev2 | | 5 day EMA | 7.86 | 7.86 | 7.87 | | 12 day EMA | 7.88 | 7.88 | 7.88 | | 20 day EMA | 7.87 | 7.87 | 7.87 | | 35 day EMA | 7.83 | 7.83 | 7.83 | | 50 day EMA | 7.76 | 7.76 | 7.76 |
SMA (simple moving average) of Western Asset SBI
| SMA period | SMA current | SMA prev | SMA prev2 | | 5 day SMA | 7.86 | 7.86 | 7.88 | | 12 day SMA | 7.89 | 7.9 | 7.9 | | 20 day SMA | 7.89 | 7.89 | 7.9 | | 35 day SMA | 7.85 | 7.84 | 7.83 | | 50 day SMA | 7.79 | 7.78 | 7.78 | | 100 day SMA | 7.67 | 7.67 | 7.66 | | 150 day SMA | 7.65 | 7.65 | 7.65 | | 200 day SMA | 7.7 | 7.7 | 7.7 |
|
|
