SandstormGold SAND full analysis,charts,indicators,moving averages,SMA,DMA,EMA,ADX,MACD,RSISandstorm Gold SAND WideScreen charts, DMA,SMA,EMA technical analysis, forecast prediction, by indicators ADX,MACD,RSI,CCI NYSE stock exchange
Daily price and charts and targets SandstormGold Strong Daily Stock price targets for SandstormGold SAND are 11.72 and 12.45 | Daily Target 1 | 11.59 | | Daily Target 2 | 11.85 | | Daily Target 3 | 12.316666666667 | | Daily Target 4 | 12.58 | | Daily Target 5 | 13.05 |
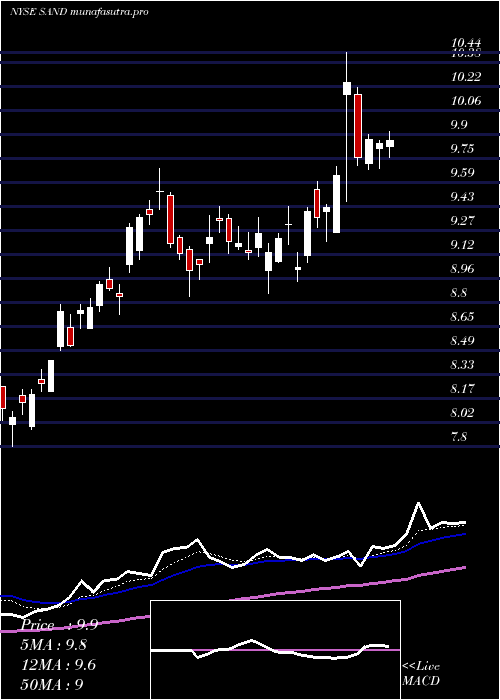
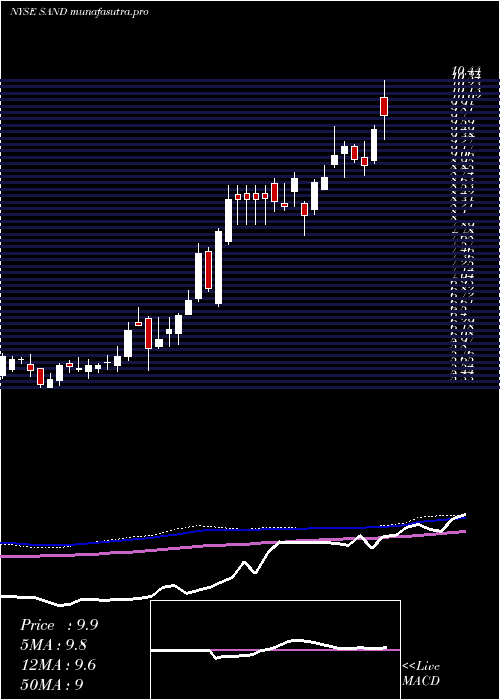
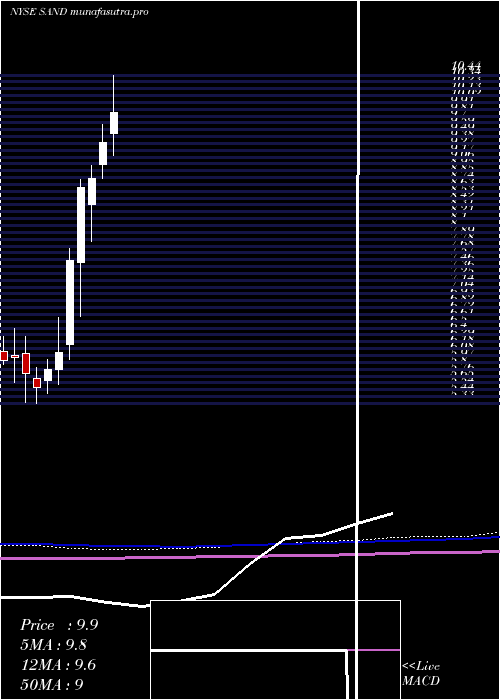
Daily price and volume Sandstorm Gold
| Date |
Closing |
Open |
Range |
Volume |
Fri 17 October 2025 |
12.12 (-6.05%) |
12.78 |
12.05 - 12.78 |
2.1137 times |
Thu 16 October 2025 |
12.90 (2.3%) |
12.64 |
12.61 - 13.09 |
0.9136 times |
Wed 15 October 2025 |
12.61 (1.37%) |
12.50 |
12.47 - 12.73 |
1.1615 times |
Tue 14 October 2025 |
12.44 (-0.16%) |
12.34 |
12.17 - 12.74 |
1.3197 times |
Mon 13 October 2025 |
12.46 (0.73%) |
12.37 |
12.28 - 12.60 |
0.6248 times |
Tue 07 October 2025 |
12.37 (-2.98%) |
12.70 |
12.26 - 12.75 |
0.7654 times |
Mon 06 October 2025 |
12.75 (3.24%) |
12.60 |
12.55 - 12.86 |
0.7113 times |
Fri 03 October 2025 |
12.35 (-0.4%) |
12.37 |
12.35 - 12.56 |
0.7399 times |
Thu 02 October 2025 |
12.40 (-0.64%) |
12.52 |
12.03 - 12.68 |
0.8524 times |
Wed 01 October 2025 |
12.48 (-0.32%) |
12.56 |
12.33 - 12.66 |
0.7976 times |
Tue 30 September 2025 |
12.52 (1.38%) |
12.24 |
12.18 - 12.61 |
1.015 times |
Weekly price and charts SandstormGold Strong weekly Stock price targets for SandstormGold SAND are 11.57 and 12.61 | Weekly Target 1 | 11.38 | | Weekly Target 2 | 11.75 | | Weekly Target 3 | 12.42 | | Weekly Target 4 | 12.79 | | Weekly Target 5 | 13.46 |
Weekly price and volumes for Sandstorm Gold
| Date |
Closing |
Open |
Range |
Volume |
Fri 17 October 2025 |
12.12 (-2.02%) |
12.37 |
12.05 - 13.09 |
1.901 times |
Tue 07 October 2025 |
12.37 (0.16%) |
12.60 |
12.26 - 12.86 |
0.4577 times |
Fri 03 October 2025 |
12.35 (0.65%) |
12.40 |
12.03 - 12.68 |
1.3812 times |
Fri 26 September 2025 |
12.27 (2.34%) |
12.01 |
11.69 - 12.35 |
1.1263 times |
Fri 19 September 2025 |
11.99 (1.7%) |
11.78 |
11.43 - 12.19 |
1.3471 times |
Fri 12 September 2025 |
11.79 (2.7%) |
11.62 |
11.45 - 11.88 |
0.79 times |
Fri 05 September 2025 |
11.48 (2.87%) |
11.30 |
11.03 - 11.54 |
0.9079 times |
Fri 29 August 2025 |
11.16 (0%) |
10.96 |
10.94 - 11.21 |
0.1999 times |
Fri 29 August 2025 |
11.16 (1.64%) |
11.10 |
10.80 - 11.21 |
0.9921 times |
Fri 22 August 2025 |
10.98 (3.49%) |
10.61 |
10.32 - 11.01 |
0.8967 times |
Fri 15 August 2025 |
10.61 (1.82%) |
10.14 |
10.10 - 10.76 |
1.2215 times |
Monthly price and charts SandstormGold Strong monthly Stock price targets for SandstormGold SAND are 11.55 and 12.61 | Monthly Target 1 | 11.35 | | Monthly Target 2 | 11.74 | | Monthly Target 3 | 12.413333333333 | | Monthly Target 4 | 12.8 | | Monthly Target 5 | 13.47 |
Monthly price and volumes Sandstorm Gold
| Date |
Closing |
Open |
Range |
Volume |
Fri 17 October 2025 |
12.12 (-3.19%) |
12.56 |
12.03 - 13.09 |
0.6106 times |
Tue 30 September 2025 |
12.52 (12.19%) |
11.30 |
11.03 - 12.61 |
0.948 times |
Fri 29 August 2025 |
11.16 (19.23%) |
9.50 |
9.36 - 11.21 |
1.0172 times |
Thu 31 July 2025 |
9.36 (-0.43%) |
9.54 |
9.20 - 10.44 |
1.8639 times |
Mon 30 June 2025 |
9.40 (6.33%) |
9.05 |
8.84 - 9.68 |
0.8919 times |
Fri 30 May 2025 |
8.84 (1.61%) |
8.43 |
7.86 - 9.03 |
0.892 times |
Wed 30 April 2025 |
8.70 (15.23%) |
7.53 |
6.68 - 8.82 |
0.9834 times |
Mon 31 March 2025 |
7.55 (23.16%) |
6.24 |
6.02 - 7.74 |
0.6925 times |
Fri 28 February 2025 |
6.13 (4.79%) |
5.85 |
5.62 - 6.67 |
1.1037 times |
Fri 31 January 2025 |
5.85 (4.84%) |
5.68 |
5.48 - 6.02 |
0.9968 times |
Tue 31 December 2024 |
5.58 (-3.79%) |
5.72 |
5.33 - 5.89 |
0.4963 times |
DMA SMA EMA moving averages of Sandstorm Gold SAND
DMA (daily moving average) of Sandstorm Gold SAND
| DMA period | DMA value | | 5 day DMA | 12.51 | | 12 day DMA | 12.48 | | 20 day DMA | 12.26 | | 35 day DMA | 11.91 | | 50 day DMA | 11.51 | | 100 day DMA | 10.44 | | 150 day DMA | 9.58 | | 200 day DMA | 8.68 | EMA (exponential moving average) of Sandstorm Gold SAND
| EMA period | EMA current | EMA prev | EMA prev2 | | 5 day EMA | 12.46 | 12.63 | 12.5 | | 12 day EMA | 12.41 | 12.46 | 12.38 | | 20 day EMA | 12.24 | 12.25 | 12.18 | | 35 day EMA | 11.84 | 11.82 | 11.76 | | 50 day EMA | 11.45 | 11.42 | 11.36 |
SMA (simple moving average) of Sandstorm Gold SAND
| SMA period | SMA current | SMA prev | SMA prev2 | | 5 day SMA | 12.51 | 12.56 | 12.53 | | 12 day SMA | 12.48 | 12.49 | 12.42 | | 20 day SMA | 12.26 | 12.24 | 12.21 | | 35 day SMA | 11.91 | 11.88 | 11.83 | | 50 day SMA | 11.51 | 11.47 | 11.4 | | 100 day SMA | 10.44 | 10.4 | 10.35 | | 150 day SMA | 9.58 | 9.54 | 9.49 | | 200 day SMA | 8.68 | 8.65 | 8.61 |
|
|
