SeabridgeGold SA full analysis,charts,indicators,moving averages,SMA,DMA,EMA,ADX,MACD,RSISeabridge Gold SA WideScreen charts, DMA,SMA,EMA technical analysis, forecast prediction, by indicators ADX,MACD,RSI,CCI NYSE stock exchange
operates under Basic Industries sector & deals in Precious Metals
Daily price and charts and targets SeabridgeGold Strong Daily Stock price targets for SeabridgeGold SA are 22.31 and 23.99 | Daily Target 1 | 21.93 | | Daily Target 2 | 22.69 | | Daily Target 3 | 23.606666666667 | | Daily Target 4 | 24.37 | | Daily Target 5 | 25.29 |
Daily price and volume Seabridge Gold
| Date |
Closing |
Open |
Range |
Volume |
Tue 21 October 2025 |
23.46 (-11.77%) |
24.42 |
22.84 - 24.52 |
1.2055 times |
Mon 20 October 2025 |
26.59 (1.41%) |
26.84 |
26.00 - 26.84 |
0.8019 times |
Fri 17 October 2025 |
26.22 (-9.43%) |
28.08 |
25.78 - 28.18 |
1.1305 times |
Thu 16 October 2025 |
28.95 (3.95%) |
28.25 |
27.91 - 29.31 |
1.0948 times |
Wed 15 October 2025 |
27.85 (6.54%) |
26.64 |
26.53 - 27.94 |
0.8471 times |
Tue 14 October 2025 |
26.14 (-0.8%) |
26.00 |
25.68 - 26.72 |
0.6415 times |
Mon 13 October 2025 |
26.35 (7.29%) |
25.55 |
25.48 - 26.74 |
0.8542 times |
Tue 07 October 2025 |
24.56 (-0.57%) |
24.73 |
24.36 - 25.20 |
0.7908 times |
Mon 06 October 2025 |
24.70 (2.07%) |
24.37 |
24.25 - 25.08 |
0.6352 times |
Fri 03 October 2025 |
24.20 (-3.16%) |
24.79 |
23.29 - 25.22 |
1.9987 times |
Thu 02 October 2025 |
24.99 (0.04%) |
25.38 |
23.68 - 25.62 |
0.8918 times |
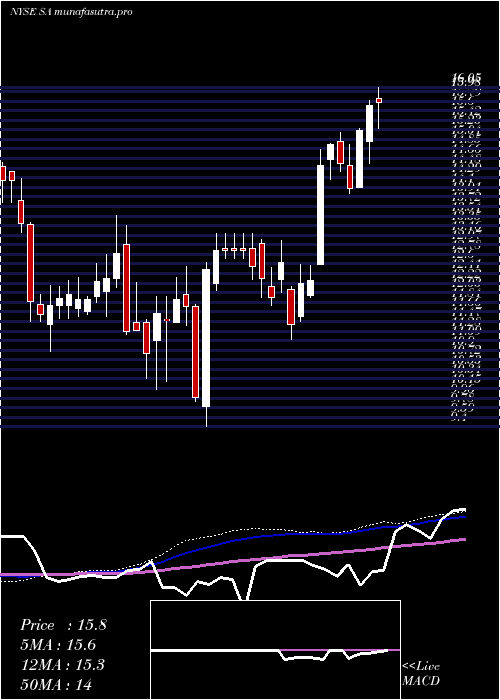
Weekly price and charts SeabridgeGold Strong weekly Stock price targets for SeabridgeGold SA are 21.15 and 25.15 | Weekly Target 1 | 20.38 | | Weekly Target 2 | 21.92 | | Weekly Target 3 | 24.38 | | Weekly Target 4 | 25.92 | | Weekly Target 5 | 28.38 |
Weekly price and volumes for Seabridge Gold
| Date |
Closing |
Open |
Range |
Volume |
Tue 21 October 2025 |
23.46 (-10.53%) |
26.84 |
22.84 - 26.84 |
0.4913 times |
Fri 17 October 2025 |
26.22 (6.76%) |
25.55 |
25.48 - 29.31 |
1.118 times |
Tue 07 October 2025 |
24.56 (1.49%) |
24.37 |
24.25 - 25.20 |
0.349 times |
Fri 03 October 2025 |
24.20 (10.5%) |
22.60 |
22.14 - 25.62 |
1.823 times |
Fri 26 September 2025 |
21.90 (8.68%) |
20.89 |
20.59 - 22.74 |
1.361 times |
Fri 19 September 2025 |
20.15 (7.01%) |
19.23 |
18.51 - 20.44 |
2.3021 times |
Fri 12 September 2025 |
18.83 (6.2%) |
18.00 |
17.28 - 19.01 |
0.9085 times |
Fri 05 September 2025 |
17.73 (1.66%) |
17.93 |
17.13 - 18.00 |
0.6055 times |
Fri 29 August 2025 |
17.44 (0%) |
16.48 |
16.45 - 17.59 |
0.2304 times |
Fri 29 August 2025 |
17.44 (5.44%) |
16.55 |
16.32 - 17.59 |
0.8112 times |
Fri 22 August 2025 |
16.54 (-1.02%) |
16.87 |
15.98 - 17.08 |
0.6167 times |
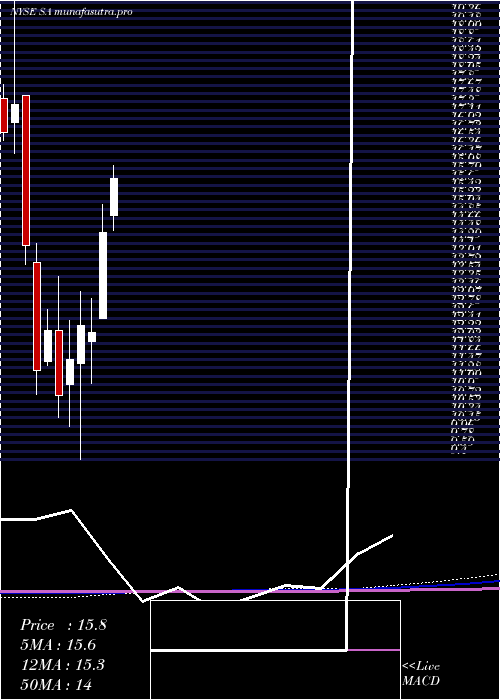
Monthly price and charts SeabridgeGold Strong monthly Stock price targets for SeabridgeGold SA are 19.92 and 26.39 | Monthly Target 1 | 18.73 | | Monthly Target 2 | 21.1 | | Monthly Target 3 | 25.203333333333 | | Monthly Target 4 | 27.57 | | Monthly Target 5 | 31.67 |
Monthly price and volumes Seabridge Gold
| Date |
Closing |
Open |
Range |
Volume |
Tue 21 October 2025 |
23.46 (-2.86%) |
24.47 |
22.84 - 29.31 |
0.9607 times |
Tue 30 September 2025 |
24.15 (38.47%) |
17.93 |
17.13 - 24.19 |
1.9623 times |
Fri 29 August 2025 |
17.44 (13.84%) |
15.60 |
15.11 - 17.59 |
0.9453 times |
Thu 31 July 2025 |
15.32 (5.51%) |
14.92 |
14.57 - 17.14 |
0.7284 times |
Mon 30 June 2025 |
14.52 (18.34%) |
12.59 |
12.58 - 15.17 |
0.8755 times |
Fri 30 May 2025 |
12.27 (-1.29%) |
12.06 |
11.12 - 13.05 |
0.7807 times |
Wed 30 April 2025 |
12.43 (6.51%) |
11.57 |
9.40 - 13.19 |
0.9754 times |
Mon 31 March 2025 |
11.67 (7.66%) |
11.10 |
10.14 - 12.54 |
1.2451 times |
Fri 28 February 2025 |
10.84 (-11.94%) |
12.31 |
10.35 - 13.54 |
0.8602 times |
Fri 31 January 2025 |
12.31 (7.89%) |
11.62 |
11.53 - 12.78 |
0.6664 times |
Tue 31 December 2024 |
11.41 (-19.87%) |
13.85 |
10.87 - 14.28 |
0.5341 times |
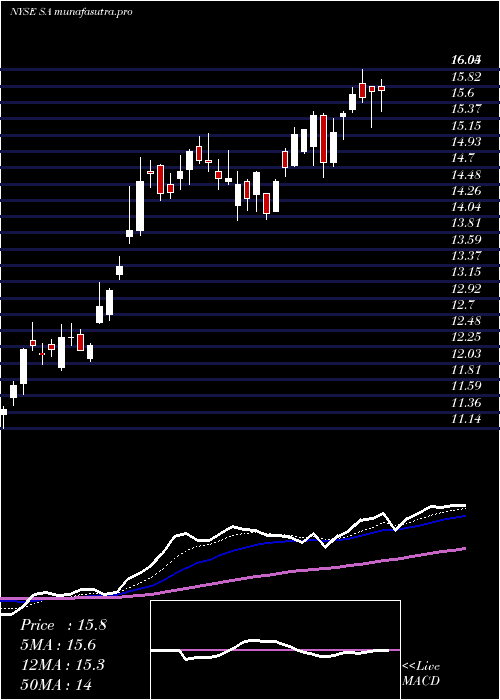
DMA SMA EMA moving averages of Seabridge Gold SA
DMA (daily moving average) of Seabridge Gold SA
| DMA period | DMA value | | 5 day DMA | 26.61 | | 12 day DMA | 25.75 | | 20 day DMA | 24.27 | | 35 day DMA | 21.69 | | 50 day DMA | 20.15 | | 100 day DMA | 17.5 | | 150 day DMA | 15.66 | | 200 day DMA | 14.71 | EMA (exponential moving average) of Seabridge Gold SA
| EMA period | EMA current | EMA prev | EMA prev2 | | 5 day EMA | 25.65 | 26.75 | 26.83 | | 12 day EMA | 25.31 | 25.65 | 25.48 | | 20 day EMA | 24.24 | 24.32 | 24.08 | | 35 day EMA | 22.42 | 22.36 | 22.11 | | 50 day EMA | 20.44 | 20.32 | 20.06 |
SMA (simple moving average) of Seabridge Gold SA
| SMA period | SMA current | SMA prev | SMA prev2 | | 5 day SMA | 26.61 | 27.15 | 27.1 | | 12 day SMA | 25.75 | 25.81 | 25.57 | | 20 day SMA | 24.27 | 24.06 | 23.69 | | 35 day SMA | 21.69 | 21.49 | 21.21 | | 50 day SMA | 20.15 | 20.01 | 19.81 | | 100 day SMA | 17.5 | 17.39 | 17.25 | | 150 day SMA | 15.66 | 15.58 | 15.48 | | 200 day SMA | 14.71 | 14.65 | 14.57 |
|
|
