RyersonHolding RYI full analysis,charts,indicators,moving averages,SMA,DMA,EMA,ADX,MACD,RSIRyerson Holding RYI WideScreen charts, DMA,SMA,EMA technical analysis, forecast prediction, by indicators ADX,MACD,RSI,CCI NYSE stock exchange
operates under Basic Industries sector & deals in Metal Fabrications
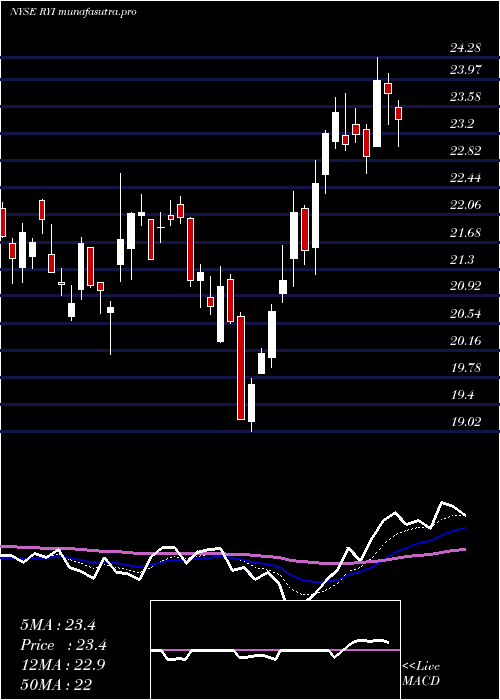
Daily price and charts and targets RyersonHolding Strong Daily Stock price targets for RyersonHolding RYI are 23.73 and 24.67 | Daily Target 1 | 22.98 | | Daily Target 2 | 23.53 | | Daily Target 3 | 23.923333333333 | | Daily Target 4 | 24.47 | | Daily Target 5 | 24.86 |
Daily price and volume Ryerson Holding
| Date |
Closing |
Open |
Range |
Volume |
Thu 04 December 2025 |
24.07 (0.84%) |
23.66 |
23.38 - 24.32 |
1.2947 times |
Wed 03 December 2025 |
23.87 (4.92%) |
22.81 |
22.81 - 24.07 |
0.8716 times |
Tue 02 December 2025 |
22.75 (-2.23%) |
23.35 |
22.59 - 23.35 |
0.7837 times |
Mon 01 December 2025 |
23.27 (1.48%) |
22.66 |
22.65 - 23.54 |
1.0726 times |
Fri 28 November 2025 |
22.93 (0.35%) |
22.83 |
22.66 - 22.98 |
0.3387 times |
Wed 26 November 2025 |
22.85 (0.44%) |
22.63 |
22.62 - 22.92 |
0.8346 times |
Tue 25 November 2025 |
22.75 (5.67%) |
21.59 |
21.45 - 22.95 |
0.9731 times |
Mon 24 November 2025 |
21.53 (0%) |
21.39 |
21.20 - 21.83 |
0.9653 times |
Fri 21 November 2025 |
21.53 (4.92%) |
20.53 |
20.51 - 21.75 |
1.1818 times |
Thu 20 November 2025 |
20.52 (-0.34%) |
20.80 |
20.39 - 21.19 |
1.684 times |
Wed 19 November 2025 |
20.59 (2.44%) |
20.16 |
19.98 - 20.66 |
1.0159 times |
Weekly price and charts RyersonHolding Strong weekly Stock price targets for RyersonHolding RYI are 23.33 and 25.06 | Weekly Target 1 | 21.93 | | Weekly Target 2 | 23 | | Weekly Target 3 | 23.66 | | Weekly Target 4 | 24.73 | | Weekly Target 5 | 25.39 |
Weekly price and volumes for Ryerson Holding
| Date |
Closing |
Open |
Range |
Volume |
Thu 04 December 2025 |
24.07 (4.97%) |
22.66 |
22.59 - 24.32 |
0.834 times |
Fri 28 November 2025 |
22.93 (6.5%) |
21.39 |
21.20 - 22.98 |
0.6452 times |
Fri 21 November 2025 |
21.53 (6.69%) |
20.07 |
19.42 - 21.75 |
1.5052 times |
Fri 14 November 2025 |
20.18 (-1.51%) |
20.63 |
19.69 - 20.80 |
1.3505 times |
Fri 07 November 2025 |
20.49 (-7.12%) |
20.66 |
20.35 - 21.37 |
1.1949 times |
Fri 31 October 2025 |
22.06 (0%) |
21.16 |
20.71 - 22.69 |
0.414 times |
Fri 31 October 2025 |
22.06 (-5.85%) |
23.46 |
19.70 - 23.74 |
2.6643 times |
Fri 24 October 2025 |
23.43 (2.99%) |
23.13 |
22.55 - 23.87 |
0.6462 times |
Fri 17 October 2025 |
22.75 (-2.07%) |
22.47 |
22.09 - 23.37 |
0.5309 times |
Tue 07 October 2025 |
23.23 (-4.83%) |
24.42 |
23.18 - 24.54 |
0.2147 times |
Fri 03 October 2025 |
24.41 (7.39%) |
22.89 |
22.29 - 24.43 |
0.4749 times |
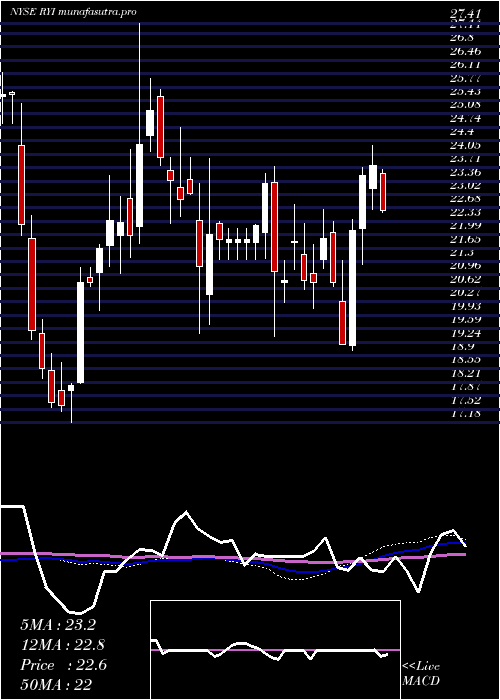
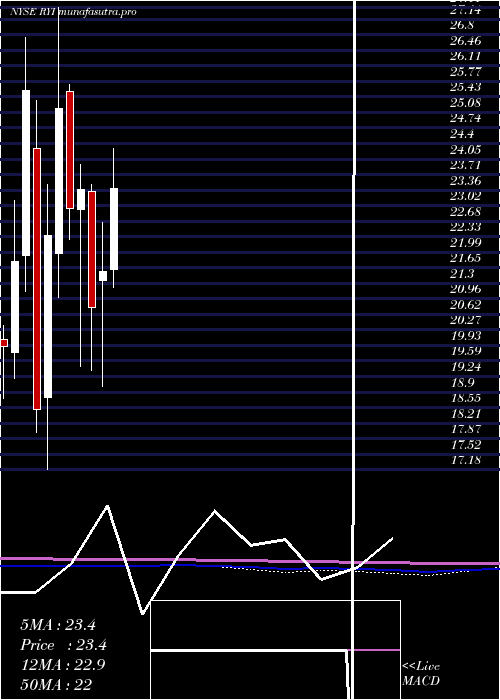
Monthly price and charts RyersonHolding Strong monthly Stock price targets for RyersonHolding RYI are 23.33 and 25.06 | Monthly Target 1 | 21.93 | | Monthly Target 2 | 23 | | Monthly Target 3 | 23.66 | | Monthly Target 4 | 24.73 | | Monthly Target 5 | 25.39 |
Monthly price and volumes Ryerson Holding
| Date |
Closing |
Open |
Range |
Volume |
Thu 04 December 2025 |
24.07 (4.97%) |
22.66 |
22.59 - 24.32 |
0.2854 times |
Fri 28 November 2025 |
22.93 (3.94%) |
20.66 |
19.42 - 22.98 |
1.607 times |
Fri 31 October 2025 |
22.06 (-3.5%) |
22.74 |
19.70 - 24.54 |
1.6214 times |
Tue 30 September 2025 |
22.86 (0.26%) |
22.53 |
21.80 - 23.76 |
0.9919 times |
Fri 29 August 2025 |
22.80 (10.68%) |
20.39 |
20.19 - 23.35 |
0.8612 times |
Thu 31 July 2025 |
20.60 (-4.5%) |
21.61 |
19.76 - 24.59 |
1.1852 times |
Mon 30 June 2025 |
21.57 (3.9%) |
21.36 |
19.02 - 22.64 |
0.98 times |
Fri 30 May 2025 |
20.76 (-11.21%) |
23.33 |
19.38 - 23.49 |
0.7301 times |
Wed 30 April 2025 |
23.38 (1.83%) |
22.94 |
19.46 - 23.93 |
0.8809 times |
Mon 31 March 2025 |
22.96 (-8.82%) |
25.54 |
22.27 - 25.70 |
0.8568 times |
Fri 28 February 2025 |
25.18 (12.61%) |
21.96 |
20.99 - 27.41 |
1.0346 times |
DMA SMA EMA moving averages of Ryerson Holding RYI
DMA (daily moving average) of Ryerson Holding RYI
| DMA period | DMA value | | 5 day DMA | 23.38 | | 12 day DMA | 22.23 | | 20 day DMA | 21.46 | | 35 day DMA | 21.89 | | 50 day DMA | 22.24 | | 100 day DMA | 22.32 | | 150 day DMA | 22.08 | | 200 day DMA | 22.33 | EMA (exponential moving average) of Ryerson Holding RYI
| EMA period | EMA current | EMA prev | EMA prev2 | | 5 day EMA | 23.41 | 23.08 | 22.68 | | 12 day EMA | 22.57 | 22.3 | 22.02 | | 20 day EMA | 22.21 | 22.01 | 21.81 | | 35 day EMA | 22.16 | 22.05 | 21.94 | | 50 day EMA | 22.41 | 22.34 | 22.28 |
SMA (simple moving average) of Ryerson Holding RYI
| SMA period | SMA current | SMA prev | SMA prev2 | | 5 day SMA | 23.38 | 23.13 | 22.91 | | 12 day SMA | 22.23 | 21.88 | 21.57 | | 20 day SMA | 21.46 | 21.3 | 21.14 | | 35 day SMA | 21.89 | 21.86 | 21.83 | | 50 day SMA | 22.24 | 22.2 | 22.19 | | 100 day SMA | 22.32 | 22.32 | 22.31 | | 150 day SMA | 22.08 | 22.08 | 22.07 | | 200 day SMA | 22.33 | 22.32 | 22.31 |
|
|
