RaytheonTechnologies RTX full analysis,charts,indicators,moving averages,SMA,DMA,EMA,ADX,MACD,RSIRaytheon Technologies RTX WideScreen charts, DMA,SMA,EMA technical analysis, forecast prediction, by indicators ADX,MACD,RSI,CCI NYSE stock exchange
Daily price and charts and targets RaytheonTechnologies Strong Daily Stock price targets for RaytheonTechnologies RTX are 159.5 and 163.25 | Daily Target 1 | 156.6 | | Daily Target 2 | 158.64 | | Daily Target 3 | 160.35333333333 | | Daily Target 4 | 162.39 | | Daily Target 5 | 164.1 |
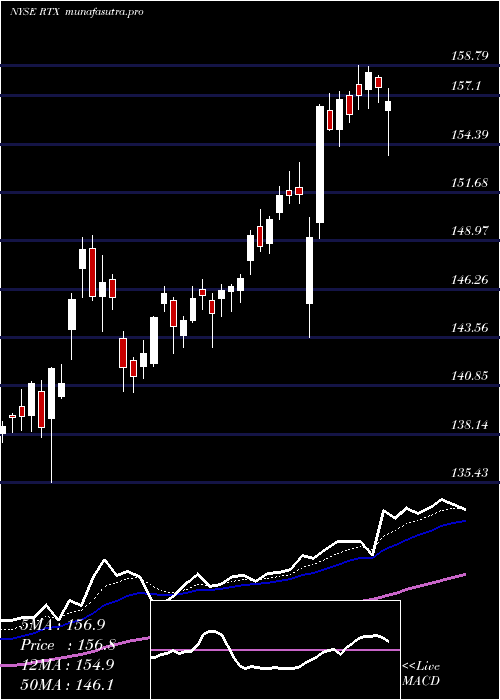
Daily price and volume Raytheon Technologies
| Date |
Closing |
Open |
Range |
Volume |
Mon 20 October 2025 |
160.67 (1.72%) |
158.56 |
158.32 - 162.07 |
0.8604 times |
Fri 17 October 2025 |
157.95 (0.57%) |
156.33 |
156.10 - 158.54 |
1.3644 times |
Thu 16 October 2025 |
157.05 (0.03%) |
157.77 |
156.10 - 158.33 |
0.9856 times |
Wed 15 October 2025 |
157.00 (-1.51%) |
159.49 |
155.64 - 160.66 |
1.4949 times |
Tue 14 October 2025 |
159.40 (0.35%) |
158.20 |
157.29 - 160.58 |
0.9014 times |
Mon 13 October 2025 |
158.85 (-6.16%) |
158.45 |
157.37 - 159.55 |
1.3362 times |
Tue 07 October 2025 |
169.27 (0.12%) |
169.36 |
168.82 - 170.36 |
1.3021 times |
Mon 06 October 2025 |
169.06 (1.55%) |
167.05 |
166.77 - 169.76 |
0.684 times |
Fri 03 October 2025 |
166.48 (-0.09%) |
167.22 |
165.50 - 167.92 |
0.4651 times |
Thu 02 October 2025 |
166.63 (-0.34%) |
167.44 |
165.89 - 168.25 |
0.6058 times |
Wed 01 October 2025 |
167.20 (-0.08%) |
165.87 |
165.08 - 167.72 |
1.0128 times |
Weekly price and charts RaytheonTechnologies Strong weekly Stock price targets for RaytheonTechnologies RTX are 159.5 and 163.25 | Weekly Target 1 | 156.6 | | Weekly Target 2 | 158.64 | | Weekly Target 3 | 160.35333333333 | | Weekly Target 4 | 162.39 | | Weekly Target 5 | 164.1 |
Weekly price and volumes for Raytheon Technologies
| Date |
Closing |
Open |
Range |
Volume |
Mon 20 October 2025 |
160.67 (1.72%) |
158.56 |
158.32 - 162.07 |
0.2192 times |
Fri 17 October 2025 |
157.95 (-6.69%) |
158.45 |
155.64 - 160.66 |
1.5497 times |
Tue 07 October 2025 |
169.27 (1.68%) |
167.05 |
166.77 - 170.36 |
0.506 times |
Fri 03 October 2025 |
166.48 (1.92%) |
167.43 |
162.79 - 168.28 |
1.2415 times |
Fri 26 September 2025 |
163.35 (3.23%) |
158.07 |
157.67 - 165.35 |
1.1981 times |
Fri 19 September 2025 |
158.24 (1.53%) |
155.93 |
155.71 - 159.95 |
1.6116 times |
Fri 12 September 2025 |
155.85 (-1.06%) |
156.92 |
150.61 - 158.14 |
1.4703 times |
Fri 05 September 2025 |
157.52 (-0.68%) |
158.20 |
155.56 - 159.17 |
0.8484 times |
Fri 29 August 2025 |
158.60 (0%) |
161.06 |
158.43 - 161.10 |
0.2414 times |
Fri 29 August 2025 |
158.60 (1.51%) |
156.63 |
156.00 - 161.26 |
1.1137 times |
Fri 22 August 2025 |
156.24 (1.4%) |
154.43 |
153.09 - 157.94 |
1.144 times |

Monthly price and charts RaytheonTechnologies Strong monthly Stock price targets for RaytheonTechnologies RTX are 150.8 and 165.52 | Monthly Target 1 | 147.5 | | Monthly Target 2 | 154.09 | | Monthly Target 3 | 162.22333333333 | | Monthly Target 4 | 168.81 | | Monthly Target 5 | 176.94 |
Monthly price and volumes Raytheon Technologies
| Date |
Closing |
Open |
Range |
Volume |
Mon 20 October 2025 |
160.67 (-3.98%) |
165.87 |
155.64 - 170.36 |
0.4577 times |
Tue 30 September 2025 |
167.33 (5.5%) |
158.20 |
150.61 - 168.28 |
0.9525 times |
Fri 29 August 2025 |
158.60 (0.65%) |
156.29 |
152.66 - 161.26 |
0.8377 times |
Thu 31 July 2025 |
157.57 (7.91%) |
145.65 |
142.66 - 158.79 |
1.0945 times |
Mon 30 June 2025 |
146.02 (6.99%) |
136.42 |
135.43 - 149.26 |
1.2946 times |
Fri 30 May 2025 |
136.48 (8.21%) |
126.40 |
125.43 - 138.82 |
1.0655 times |
Wed 30 April 2025 |
126.13 (-4.78%) |
132.28 |
112.27 - 133.71 |
1.1324 times |
Mon 31 March 2025 |
132.46 (-0.4%) |
134.34 |
125.96 - 136.17 |
1.0941 times |
Fri 28 February 2025 |
132.99 (3.13%) |
128.50 |
121.38 - 133.09 |
1.0056 times |
Fri 31 January 2025 |
128.95 (11.43%) |
116.97 |
113.73 - 132.43 |
1.0654 times |
Tue 31 December 2024 |
115.72 (-4.05%) |
117.35 |
114.22 - 118.35 |
0.7058 times |

DMA SMA EMA moving averages of Raytheon Technologies RTX
DMA (daily moving average) of Raytheon Technologies RTX
| DMA period | DMA value | | 5 day DMA | 158.41 | | 12 day DMA | 163.07 | | 20 day DMA | 162.11 | | 35 day DMA | 160.06 | | 50 day DMA | 158.84 | | 100 day DMA | 152.33 | | 150 day DMA | 144.63 | | 200 day DMA | 139.57 | EMA (exponential moving average) of Raytheon Technologies RTX
| EMA period | EMA current | EMA prev | EMA prev2 | | 5 day EMA | 159.62 | 159.09 | 159.66 | | 12 day EMA | 160.97 | 161.03 | 161.59 | | 20 day EMA | 161.05 | 161.09 | 161.42 | | 35 day EMA | 160.27 | 160.25 | 160.39 | | 50 day EMA | 158.64 | 158.56 | 158.59 |
SMA (simple moving average) of Raytheon Technologies RTX
| SMA period | SMA current | SMA prev | SMA prev2 | | 5 day SMA | 158.41 | 158.05 | 160.31 | | 12 day SMA | 163.07 | 163.32 | 163.77 | | 20 day SMA | 162.11 | 161.99 | 162.02 | | 35 day SMA | 160.06 | 160.04 | 160.08 | | 50 day SMA | 158.84 | 158.74 | 158.71 | | 100 day SMA | 152.33 | 152.07 | 151.86 | | 150 day SMA | 144.63 | 144.41 | 144.22 | | 200 day SMA | 139.57 | 139.35 | 139.14 |
|
|
