RpmInternational RPM full analysis,charts,indicators,moving averages,SMA,DMA,EMA,ADX,MACD,RSIRpm International RPM WideScreen charts, DMA,SMA,EMA technical analysis, forecast prediction, by indicators ADX,MACD,RSI,CCI NYSE stock exchange
operates under Basic Industries sector & deals in Paints Coatings
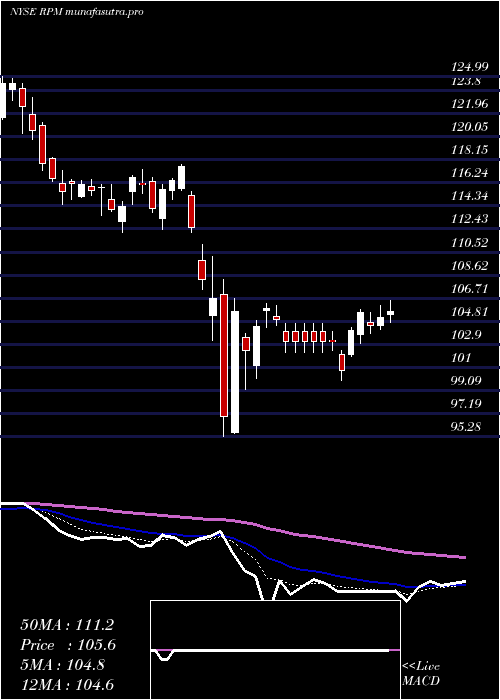
Daily price and charts and targets RpmInternational Strong Daily Stock price targets for RpmInternational RPM are 111.63 and 112.6 | Daily Target 1 | 110.84 | | Daily Target 2 | 111.44 | | Daily Target 3 | 111.81333333333 | | Daily Target 4 | 112.41 | | Daily Target 5 | 112.78 |
Daily price and volume Rpm International
| Date |
Closing |
Open |
Range |
Volume |
Mon 20 October 2025 |
112.03 (-0.14%) |
111.76 |
111.22 - 112.19 |
0.6218 times |
Fri 17 October 2025 |
112.19 (-0.49%) |
113.00 |
110.63 - 113.34 |
1.6476 times |
Thu 16 October 2025 |
112.74 (-0.74%) |
113.56 |
111.90 - 113.93 |
1.3641 times |
Wed 15 October 2025 |
113.58 (-0.42%) |
114.13 |
112.95 - 115.26 |
0.6552 times |
Tue 14 October 2025 |
114.06 (2.23%) |
112.64 |
112.16 - 115.01 |
1.326 times |
Mon 13 October 2025 |
111.57 (-1.05%) |
111.77 |
111.16 - 112.66 |
0.7449 times |
Tue 07 October 2025 |
112.75 (-1.27%) |
114.34 |
112.60 - 115.21 |
0.9624 times |
Mon 06 October 2025 |
114.20 (-2.25%) |
116.74 |
113.80 - 116.83 |
0.6589 times |
Fri 03 October 2025 |
116.83 (0.48%) |
116.36 |
115.78 - 117.38 |
1.0361 times |
Thu 02 October 2025 |
116.27 (-0.79%) |
117.40 |
115.21 - 117.40 |
0.9829 times |
Wed 01 October 2025 |
117.19 (-0.59%) |
117.91 |
115.02 - 121.94 |
2.1234 times |
Weekly price and charts RpmInternational Strong weekly Stock price targets for RpmInternational RPM are 111.63 and 112.6 | Weekly Target 1 | 110.84 | | Weekly Target 2 | 111.44 | | Weekly Target 3 | 111.81333333333 | | Weekly Target 4 | 112.41 | | Weekly Target 5 | 112.78 |
Weekly price and volumes for Rpm International
| Date |
Closing |
Open |
Range |
Volume |
Mon 20 October 2025 |
112.03 (-0.14%) |
111.76 |
111.22 - 112.19 |
0.1702 times |
Fri 17 October 2025 |
112.19 (-0.5%) |
111.77 |
110.63 - 115.26 |
1.5702 times |
Tue 07 October 2025 |
112.75 (-3.49%) |
116.74 |
112.60 - 116.83 |
0.4437 times |
Fri 03 October 2025 |
116.83 (-0.15%) |
117.21 |
114.93 - 121.94 |
2.3054 times |
Fri 26 September 2025 |
117.01 (-4.44%) |
122.31 |
115.82 - 122.81 |
1.2133 times |
Fri 19 September 2025 |
122.45 (-3.12%) |
126.77 |
122.01 - 127.14 |
1.2284 times |
Fri 12 September 2025 |
126.39 (-0.18%) |
125.90 |
124.14 - 128.52 |
1.0664 times |
Fri 05 September 2025 |
126.62 (1.05%) |
122.60 |
121.72 - 127.50 |
0.8277 times |
Fri 29 August 2025 |
125.31 (0%) |
125.93 |
124.63 - 126.18 |
0.1998 times |
Fri 29 August 2025 |
125.31 (-1.77%) |
127.10 |
124.59 - 127.10 |
0.9749 times |
Fri 22 August 2025 |
127.57 (3.55%) |
123.25 |
122.28 - 129.12 |
1.216 times |
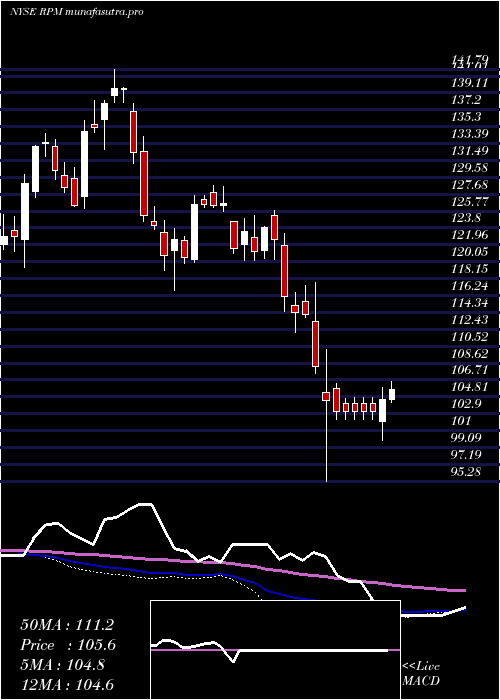
Monthly price and charts RpmInternational Strong monthly Stock price targets for RpmInternational RPM are 105.68 and 116.99 | Monthly Target 1 | 103.56 | | Monthly Target 2 | 107.79 | | Monthly Target 3 | 114.86666666667 | | Monthly Target 4 | 119.1 | | Monthly Target 5 | 126.18 |
Monthly price and volumes Rpm International
| Date |
Closing |
Open |
Range |
Volume |
Mon 20 October 2025 |
112.03 (-4.96%) |
117.91 |
110.63 - 121.94 |
0.6909 times |
Tue 30 September 2025 |
117.88 (-5.93%) |
122.60 |
114.93 - 128.52 |
1.147 times |
Fri 29 August 2025 |
125.31 (6.73%) |
116.42 |
115.14 - 129.12 |
0.9068 times |
Thu 31 July 2025 |
117.41 (6.89%) |
109.36 |
108.78 - 126.09 |
1.2791 times |
Mon 30 June 2025 |
109.84 (-3.51%) |
114.06 |
106.11 - 116.98 |
1.0868 times |
Fri 30 May 2025 |
113.84 (6.64%) |
106.27 |
105.88 - 116.33 |
1.0889 times |
Wed 30 April 2025 |
106.75 (-7.72%) |
115.60 |
95.28 - 117.76 |
1.108 times |
Mon 31 March 2025 |
115.68 (-6.63%) |
125.26 |
112.10 - 125.84 |
0.8296 times |
Fri 28 February 2025 |
123.89 (-2.14%) |
124.60 |
120.21 - 125.29 |
0.8274 times |
Fri 31 January 2025 |
126.60 (2.88%) |
122.00 |
116.83 - 128.70 |
1.0355 times |
Tue 31 December 2024 |
123.06 (-11.85%) |
136.99 |
122.31 - 137.87 |
0.6516 times |

DMA SMA EMA moving averages of Rpm International RPM
DMA (daily moving average) of Rpm International RPM
| DMA period | DMA value | | 5 day DMA | 112.92 | | 12 day DMA | 114.27 | | 20 day DMA | 116.35 | | 35 day DMA | 120.2 | | 50 day DMA | 121.25 | | 100 day DMA | 117.42 | | 150 day DMA | 114.85 | | 200 day DMA | 116.96 | EMA (exponential moving average) of Rpm International RPM
| EMA period | EMA current | EMA prev | EMA prev2 | | 5 day EMA | 112.7 | 113.03 | 113.45 | | 12 day EMA | 114.29 | 114.7 | 115.16 | | 20 day EMA | 116.04 | 116.46 | 116.91 | | 35 day EMA | 118 | 118.35 | 118.71 | | 50 day EMA | 120.22 | 120.55 | 120.89 |
SMA (simple moving average) of Rpm International RPM
| SMA period | SMA current | SMA prev | SMA prev2 | | 5 day SMA | 112.92 | 112.83 | 112.94 | | 12 day SMA | 114.27 | 114.69 | 115.09 | | 20 day SMA | 116.35 | 116.9 | 117.56 | | 35 day SMA | 120.2 | 120.6 | 120.98 | | 50 day SMA | 121.25 | 121.41 | 121.56 | | 100 day SMA | 117.42 | 117.43 | 117.46 | | 150 day SMA | 114.85 | 114.88 | 114.92 | | 200 day SMA | 116.96 | 117.01 | 117.07 |
|
|
