RockwellAutomation ROK full analysis,charts,indicators,moving averages,SMA,DMA,EMA,ADX,MACD,RSIRockwell Automation ROK WideScreen charts, DMA,SMA,EMA technical analysis, forecast prediction, by indicators ADX,MACD,RSI,CCI NYSE stock exchange
operates under Capital Goods sector & deals in Industrial Machinery Components
Daily price and charts and targets RockwellAutomation Strong Daily Stock price targets for RockwellAutomation ROK are 401.76 and 408.58 | Daily Target 1 | 396.5 | | Daily Target 2 | 400.19 | | Daily Target 3 | 403.31666666667 | | Daily Target 4 | 407.01 | | Daily Target 5 | 410.14 |
Daily price and volume Rockwell Automation
| Date |
Closing |
Open |
Range |
Volume |
Thu 04 December 2025 |
403.89 (0.88%) |
400.37 |
399.62 - 406.44 |
1.1668 times |
Wed 03 December 2025 |
400.37 (2.34%) |
391.01 |
388.54 - 400.87 |
0.6868 times |
Tue 02 December 2025 |
391.20 (0.32%) |
392.84 |
387.00 - 393.37 |
0.6423 times |
Mon 01 December 2025 |
389.96 (-1.49%) |
390.98 |
388.52 - 396.82 |
0.818 times |
Fri 28 November 2025 |
395.86 (0.47%) |
395.98 |
394.85 - 398.82 |
0.4808 times |
Wed 26 November 2025 |
393.99 (0.69%) |
391.88 |
390.98 - 397.56 |
0.7973 times |
Tue 25 November 2025 |
391.30 (1.8%) |
386.02 |
384.88 - 392.40 |
0.7429 times |
Mon 24 November 2025 |
384.37 (1.49%) |
379.45 |
376.44 - 387.16 |
1.905 times |
Fri 21 November 2025 |
378.73 (2.72%) |
371.16 |
369.04 - 384.65 |
1.4641 times |
Thu 20 November 2025 |
368.70 (-1.01%) |
382.62 |
368.32 - 383.79 |
1.296 times |
Wed 19 November 2025 |
372.48 (1.77%) |
367.63 |
365.42 - 373.66 |
1.0719 times |
Weekly price and charts RockwellAutomation Strong weekly Stock price targets for RockwellAutomation ROK are 395.45 and 414.89 | Weekly Target 1 | 379.67 | | Weekly Target 2 | 391.78 | | Weekly Target 3 | 399.11 | | Weekly Target 4 | 411.22 | | Weekly Target 5 | 418.55 |
Weekly price and volumes for Rockwell Automation
| Date |
Closing |
Open |
Range |
Volume |
Thu 04 December 2025 |
403.89 (2.03%) |
390.98 |
387.00 - 406.44 |
1.0408 times |
Fri 28 November 2025 |
395.86 (4.52%) |
379.45 |
376.44 - 398.82 |
1.233 times |
Fri 21 November 2025 |
378.73 (0.42%) |
374.05 |
363.92 - 384.65 |
1.9211 times |
Fri 14 November 2025 |
377.13 (0.97%) |
377.35 |
371.69 - 398.20 |
1.3813 times |
Fri 07 November 2025 |
373.49 (1.39%) |
359.05 |
354.11 - 396.89 |
1.4055 times |
Fri 31 October 2025 |
368.36 (0%) |
365.81 |
365.81 - 370.46 |
0.2023 times |
Fri 31 October 2025 |
368.36 (3.33%) |
360.20 |
356.64 - 375.02 |
0.9207 times |
Fri 24 October 2025 |
356.48 (2.54%) |
349.77 |
349.12 - 361.60 |
0.5492 times |
Fri 17 October 2025 |
347.66 (1%) |
338.40 |
335.17 - 354.25 |
1.0693 times |
Tue 07 October 2025 |
344.22 (-1.48%) |
352.52 |
342.18 - 352.89 |
0.2769 times |
Fri 03 October 2025 |
349.40 (1.69%) |
343.28 |
342.70 - 354.98 |
1.0215 times |
Monthly price and charts RockwellAutomation Strong monthly Stock price targets for RockwellAutomation ROK are 395.45 and 414.89 | Monthly Target 1 | 379.67 | | Monthly Target 2 | 391.78 | | Monthly Target 3 | 399.11 | | Monthly Target 4 | 411.22 | | Monthly Target 5 | 418.55 |
Monthly price and volumes Rockwell Automation
| Date |
Closing |
Open |
Range |
Volume |
Thu 04 December 2025 |
403.89 (2.03%) |
390.98 |
387.00 - 406.44 |
0.2175 times |
Fri 28 November 2025 |
395.86 (7.47%) |
359.05 |
354.11 - 398.82 |
1.2416 times |
Fri 31 October 2025 |
368.36 (5.39%) |
347.54 |
335.17 - 375.02 |
0.7598 times |
Tue 30 September 2025 |
349.53 (1.78%) |
338.71 |
334.30 - 351.51 |
0.9034 times |
Fri 29 August 2025 |
343.43 (-2.35%) |
342.91 |
305.44 - 357.36 |
1.3191 times |
Thu 31 July 2025 |
351.71 (5.88%) |
330.40 |
329.93 - 360.92 |
1.0654 times |
Mon 30 June 2025 |
332.17 (5.27%) |
315.00 |
311.17 - 332.68 |
0.9061 times |
Fri 30 May 2025 |
315.55 (27.4%) |
249.05 |
246.98 - 316.22 |
1.3129 times |
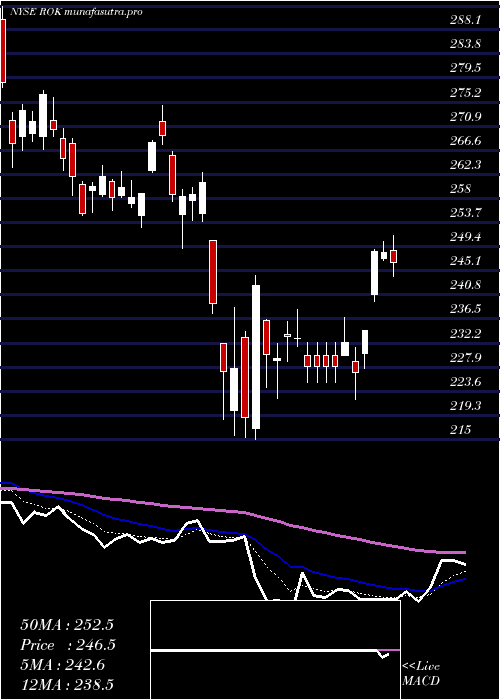
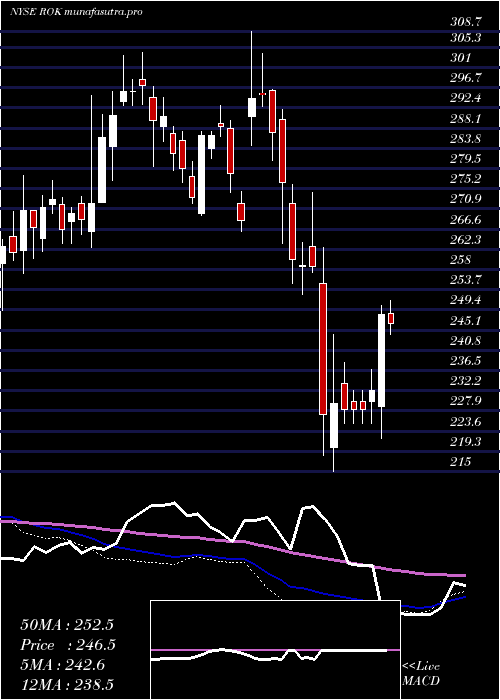
Wed 30 April 2025 |
247.68 (-4.14%) |
257.58 |
215.00 - 262.62 |
1.29 times |
Mon 31 March 2025 |
258.38 (-10.02%) |
289.96 |
249.05 - 292.17 |
0.9841 times |
Fri 28 February 2025 |
287.15 (3.13%) |
272.07 |
266.17 - 308.70 |
1.1166 times |

DMA SMA EMA moving averages of Rockwell Automation ROK
DMA (daily moving average) of Rockwell Automation ROK
| DMA period | DMA value | | 5 day DMA | 396.26 | | 12 day DMA | 386.41 | | 20 day DMA | 384.38 | | 35 day DMA | 373.44 | | 50 day DMA | 365.09 | | 100 day DMA | 355.53 | | 150 day DMA | 340.15 | | 200 day DMA | 319.96 | EMA (exponential moving average) of Rockwell Automation ROK
| EMA period | EMA current | EMA prev | EMA prev2 | | 5 day EMA | 396.98 | 393.52 | 390.1 | | 12 day EMA | 389.9 | 387.36 | 384.99 | | 20 day EMA | 384.16 | 382.08 | 380.16 | | 35 day EMA | 375.31 | 373.63 | 372.06 | | 50 day EMA | 366.65 | 365.13 | 363.69 |
SMA (simple moving average) of Rockwell Automation ROK
| SMA period | SMA current | SMA prev | SMA prev2 | | 5 day SMA | 396.26 | 394.28 | 392.46 | | 12 day SMA | 386.41 | 383.59 | 381.65 | | 20 day SMA | 384.38 | 382.31 | 380.28 | | 35 day SMA | 373.44 | 371.96 | 370.35 | | 50 day SMA | 365.09 | 363.96 | 362.93 | | 100 day SMA | 355.53 | 354.94 | 354.34 | | 150 day SMA | 340.15 | 339.11 | 338.1 | | 200 day SMA | 319.96 | 319.45 | 318.96 |
|
|
