RogersCorporation ROG full analysis,charts,indicators,moving averages,SMA,DMA,EMA,ADX,MACD,RSIRogers Corporation ROG WideScreen charts, DMA,SMA,EMA technical analysis, forecast prediction, by indicators ADX,MACD,RSI,CCI NYSE stock exchange
operates under Basic Industries sector & deals in Major Chemicals
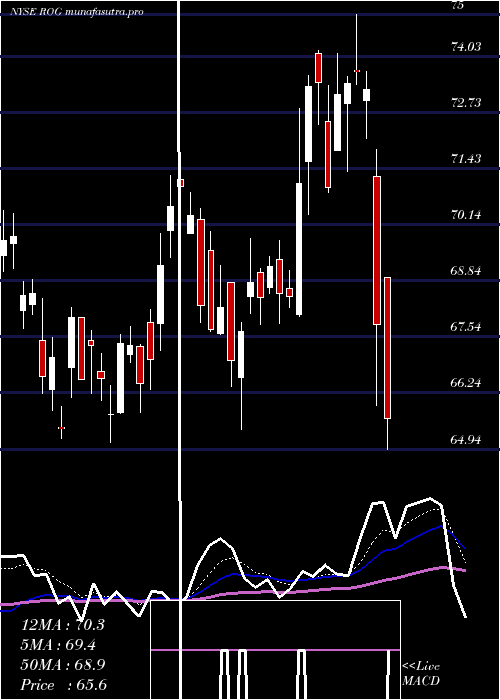
Daily price and charts and targets RogersCorporation Strong Daily Stock price targets for RogersCorporation ROG are 86.02 and 88.02 | Daily Target 1 | 85.63 | | Daily Target 2 | 86.41 | | Daily Target 3 | 87.626666666667 | | Daily Target 4 | 88.41 | | Daily Target 5 | 89.63 |
Daily price and volume Rogers Corporation
| Date |
Closing |
Open |
Range |
Volume |
Thu 04 December 2025 |
87.20 (-0.76%) |
87.45 |
86.84 - 88.84 |
0.587 times |
Wed 03 December 2025 |
87.87 (1.64%) |
86.51 |
86.51 - 88.80 |
1.0301 times |
Tue 02 December 2025 |
86.45 (2.32%) |
84.93 |
84.21 - 87.35 |
0.7874 times |
Mon 01 December 2025 |
84.49 (0.81%) |
82.67 |
82.24 - 84.84 |
0.9432 times |
Fri 28 November 2025 |
83.81 (1.69%) |
83.35 |
81.97 - 83.98 |
0.5111 times |
Wed 26 November 2025 |
82.42 (0.94%) |
80.93 |
80.93 - 84.02 |
1.578 times |
Tue 25 November 2025 |
81.65 (2.09%) |
80.79 |
80.49 - 82.54 |
0.8712 times |
Mon 24 November 2025 |
79.98 (-0.12%) |
79.78 |
78.82 - 80.53 |
1.4879 times |
Fri 21 November 2025 |
80.08 (5.98%) |
75.80 |
75.80 - 80.96 |
1.4238 times |
Thu 20 November 2025 |
75.56 (-2.01%) |
78.82 |
75.14 - 79.50 |
0.7804 times |
Wed 19 November 2025 |
77.11 (-2.69%) |
79.62 |
76.94 - 80.13 |
1.2015 times |
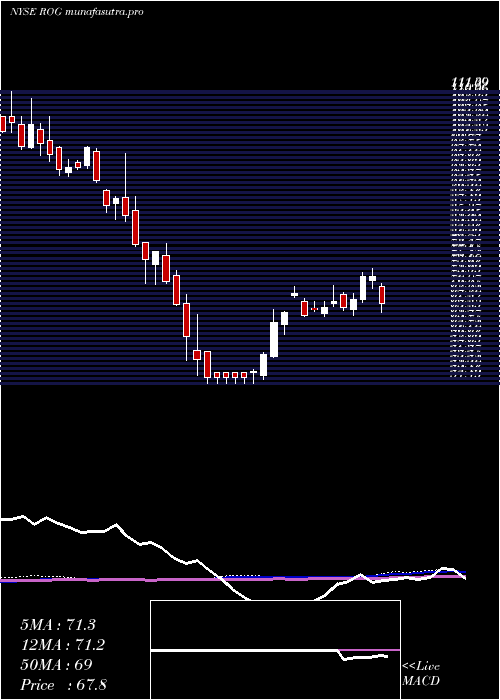
Weekly price and charts RogersCorporation Strong weekly Stock price targets for RogersCorporation ROG are 84.72 and 91.32 | Weekly Target 1 | 79.49 | | Weekly Target 2 | 83.35 | | Weekly Target 3 | 86.093333333333 | | Weekly Target 4 | 89.95 | | Weekly Target 5 | 92.69 |
Weekly price and volumes for Rogers Corporation
| Date |
Closing |
Open |
Range |
Volume |
Thu 04 December 2025 |
87.20 (4.04%) |
82.67 |
82.24 - 88.84 |
0.5892 times |
Fri 28 November 2025 |
83.81 (4.66%) |
79.78 |
78.82 - 84.02 |
0.7829 times |
Fri 21 November 2025 |
80.08 (2.21%) |
78.13 |
75.14 - 80.96 |
1.0141 times |
Fri 14 November 2025 |
78.35 (-7.04%) |
85.34 |
76.89 - 86.25 |
0.9594 times |
Fri 07 November 2025 |
84.28 (-3.72%) |
81.23 |
80.00 - 86.33 |
1.0027 times |
Fri 31 October 2025 |
87.54 (0%) |
88.18 |
84.40 - 89.12 |
0.607 times |
Fri 31 October 2025 |
87.54 (1.37%) |
87.08 |
81.31 - 98.08 |
2.7963 times |
Fri 24 October 2025 |
86.36 (2.64%) |
84.81 |
83.68 - 87.93 |
0.6675 times |
Fri 17 October 2025 |
84.14 (3.15%) |
83.11 |
82.38 - 87.16 |
0.773 times |
Fri 10 October 2025 |
81.57 (-1.81%) |
83.91 |
80.74 - 85.88 |
0.8079 times |
Fri 03 October 2025 |
83.07 (3.79%) |
80.36 |
79.19 - 84.33 |
1.0613 times |
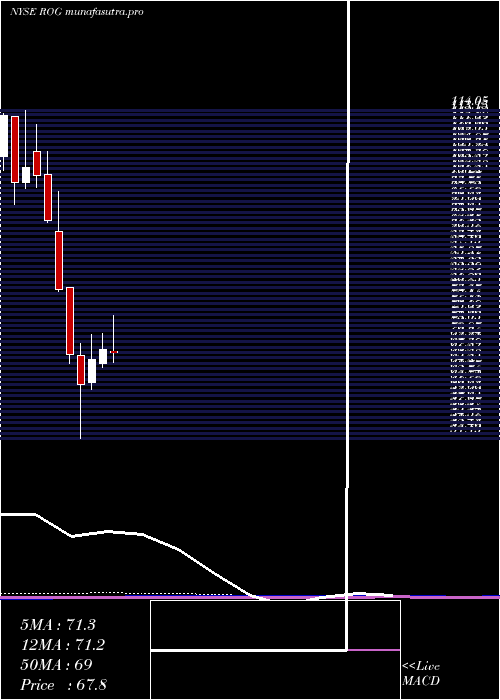
Monthly price and charts RogersCorporation Strong monthly Stock price targets for RogersCorporation ROG are 84.72 and 91.32 | Monthly Target 1 | 79.49 | | Monthly Target 2 | 83.35 | | Monthly Target 3 | 86.093333333333 | | Monthly Target 4 | 89.95 | | Monthly Target 5 | 92.69 |
Monthly price and volumes Rogers Corporation
| Date |
Closing |
Open |
Range |
Volume |
Thu 04 December 2025 |
87.20 (4.04%) |
82.67 |
82.24 - 88.84 |
0.0995 times |
Fri 28 November 2025 |
83.81 (-4.26%) |
81.23 |
75.14 - 86.33 |
0.6345 times |
Fri 31 October 2025 |
87.54 (8.8%) |
80.52 |
79.89 - 98.08 |
1.0541 times |
Tue 30 September 2025 |
80.46 (2.55%) |
77.19 |
76.30 - 84.67 |
0.9764 times |
Fri 29 August 2025 |
78.46 (19.64%) |
66.27 |
61.17 - 80.52 |
1.4645 times |
Thu 31 July 2025 |
65.58 (-4.23%) |
68.06 |
64.46 - 75.00 |
1.1795 times |
Mon 30 June 2025 |
68.48 (2.87%) |
65.73 |
65.09 - 71.56 |
0.7036 times |
Fri 30 May 2025 |
66.57 (7.7%) |
62.18 |
60.90 - 71.27 |
1.0288 times |
Wed 30 April 2025 |
61.81 (-8.47%) |
67.25 |
51.43 - 69.64 |
1.7822 times |
Mon 31 March 2025 |
67.53 (-15.52%) |
80.27 |
65.70 - 80.27 |
1.077 times |
Fri 28 February 2025 |
79.94 (-14.09%) |
91.00 |
79.45 - 98.61 |
0.7653 times |
DMA SMA EMA moving averages of Rogers Corporation ROG
DMA (daily moving average) of Rogers Corporation ROG
| DMA period | DMA value | | 5 day DMA | 85.96 | | 12 day DMA | 82.16 | | 20 day DMA | 82.02 | | 35 day DMA | 83.6 | | 50 day DMA | 83.29 | | 100 day DMA | 79.04 | | 150 day DMA | 75.47 | | 200 day DMA | 73.37 | EMA (exponential moving average) of Rogers Corporation ROG
| EMA period | EMA current | EMA prev | EMA prev2 | | 5 day EMA | 85.89 | 85.24 | 83.92 | | 12 day EMA | 83.83 | 83.22 | 82.38 | | 20 day EMA | 83.23 | 82.81 | 82.28 | | 35 day EMA | 82.86 | 82.6 | 82.29 | | 50 day EMA | 83.39 | 83.23 | 83.04 |
SMA (simple moving average) of Rogers Corporation ROG
| SMA period | SMA current | SMA prev | SMA prev2 | | 5 day SMA | 85.96 | 85.01 | 83.76 | | 12 day SMA | 82.16 | 81.29 | 80.5 | | 20 day SMA | 82.02 | 81.94 | 81.67 | | 35 day SMA | 83.6 | 83.58 | 83.46 | | 50 day SMA | 83.29 | 83.14 | 82.95 | | 100 day SMA | 79.04 | 78.82 | 78.62 | | 150 day SMA | 75.47 | 75.3 | 75.11 | | 200 day SMA | 73.37 | 73.39 | 73.4 |
|
|
