ResmedInc RMD full analysis,charts,indicators,moving averages,SMA,DMA,EMA,ADX,MACD,RSIResmed Inc RMD WideScreen charts, DMA,SMA,EMA technical analysis, forecast prediction, by indicators ADX,MACD,RSI,CCI NYSE stock exchange
operates under Health Care sector & deals in Medical Dental Instruments
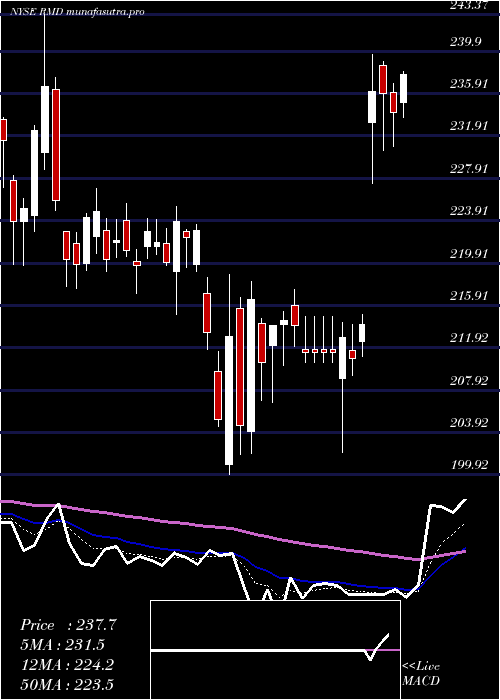
Daily price and charts and targets ResmedInc Strong Daily Stock price targets for ResmedInc RMD are 250.91 and 253.32 | Daily Target 1 | 249.11 | | Daily Target 2 | 250.29 | | Daily Target 3 | 251.52 | | Daily Target 4 | 252.7 | | Daily Target 5 | 253.93 |
Daily price and volume Resmed Inc
| Date |
Closing |
Open |
Range |
Volume |
Thu 04 December 2025 |
251.47 (0.01%) |
251.25 |
250.34 - 252.75 |
0.2939 times |
Wed 03 December 2025 |
251.44 (0.24%) |
251.47 |
250.10 - 254.10 |
0.7216 times |
Tue 02 December 2025 |
250.85 (0.99%) |
249.31 |
248.75 - 252.84 |
1.425 times |
Mon 01 December 2025 |
248.38 (-2.91%) |
244.16 |
237.63 - 253.89 |
1.7005 times |
Fri 28 November 2025 |
255.83 (0.31%) |
256.00 |
255.70 - 258.09 |
0.4396 times |
Wed 26 November 2025 |
255.04 (-0.3%) |
255.82 |
254.98 - 257.17 |
0.7953 times |
Tue 25 November 2025 |
255.80 (2.12%) |
251.59 |
250.25 - 257.00 |
1.0659 times |
Mon 24 November 2025 |
250.50 (-0.1%) |
250.78 |
248.45 - 251.57 |
0.5304 times |
Fri 21 November 2025 |
250.75 (2.8%) |
244.28 |
243.04 - 254.00 |
1.5578 times |
Thu 20 November 2025 |
243.92 (-0.44%) |
244.57 |
241.81 - 246.88 |
1.4701 times |
Wed 19 November 2025 |
244.99 (-0.5%) |
246.00 |
242.60 - 248.05 |
1.2371 times |
Weekly price and charts ResmedInc Strong weekly Stock price targets for ResmedInc RMD are 244.55 and 261.02 | Weekly Target 1 | 231.26 | | Weekly Target 2 | 241.37 | | Weekly Target 3 | 247.73333333333 | | Weekly Target 4 | 257.84 | | Weekly Target 5 | 264.2 |
Weekly price and volumes for Resmed Inc
| Date |
Closing |
Open |
Range |
Volume |
Thu 04 December 2025 |
251.47 (-1.7%) |
244.16 |
237.63 - 254.10 |
0.7078 times |
Fri 28 November 2025 |
255.83 (2.03%) |
250.78 |
248.45 - 258.09 |
0.4839 times |
Fri 21 November 2025 |
250.75 (2.57%) |
244.28 |
241.81 - 254.00 |
1.2253 times |
Fri 14 November 2025 |
244.46 (-2.8%) |
250.00 |
244.29 - 256.00 |
1.2785 times |
Fri 07 November 2025 |
251.49 (1.87%) |
247.71 |
241.62 - 251.54 |
1.4736 times |
Fri 31 October 2025 |
246.88 (0%) |
254.51 |
239.41 - 257.17 |
0.5758 times |
Fri 31 October 2025 |
246.88 (-4.86%) |
259.70 |
239.41 - 264.00 |
1.7755 times |
Fri 24 October 2025 |
259.49 (-3.21%) |
268.37 |
259.41 - 271.72 |
0.9258 times |
Fri 17 October 2025 |
268.09 (-5.36%) |
274.29 |
263.10 - 277.33 |
1.2892 times |
Tue 07 October 2025 |
283.28 (1.68%) |
279.35 |
278.32 - 283.99 |
0.2646 times |
Fri 03 October 2025 |
278.59 (3.08%) |
271.10 |
267.64 - 281.50 |
1.0464 times |
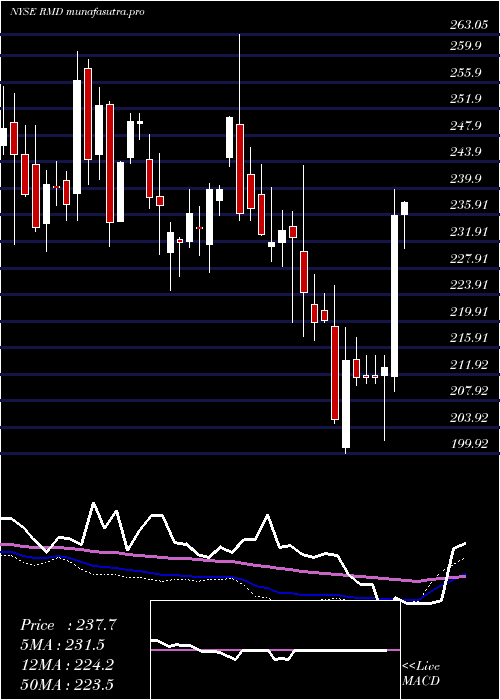
Monthly price and charts ResmedInc Strong monthly Stock price targets for ResmedInc RMD are 244.55 and 261.02 | Monthly Target 1 | 231.26 | | Monthly Target 2 | 241.37 | | Monthly Target 3 | 247.73333333333 | | Monthly Target 4 | 257.84 | | Monthly Target 5 | 264.2 |
Monthly price and volumes Resmed Inc
| Date |
Closing |
Open |
Range |
Volume |
Thu 04 December 2025 |
251.47 (-1.7%) |
244.16 |
237.63 - 254.10 |
0.1674 times |
Fri 28 November 2025 |
255.83 (3.63%) |
247.71 |
241.62 - 258.09 |
1.0553 times |
Fri 31 October 2025 |
246.88 (-9.81%) |
274.36 |
239.41 - 283.99 |
1.2761 times |
Tue 30 September 2025 |
273.73 (-0.28%) |
270.77 |
264.14 - 281.32 |
1.0537 times |
Fri 29 August 2025 |
274.51 (0.95%) |
281.90 |
271.11 - 293.81 |
1.1589 times |
Thu 31 July 2025 |
271.94 (5.4%) |
256.99 |
250.18 - 278.86 |
1.1007 times |
Mon 30 June 2025 |
258.00 (5.4%) |
243.78 |
239.93 - 260.23 |
0.8017 times |
Fri 30 May 2025 |
244.79 (3.47%) |
236.59 |
233.87 - 253.43 |
1.0103 times |
Wed 30 April 2025 |
236.59 (5.69%) |
222.86 |
199.92 - 239.66 |
1.4285 times |
Mon 31 March 2025 |
223.85 (-4.14%) |
234.10 |
215.05 - 243.37 |
0.9475 times |
Fri 28 February 2025 |
233.52 (-1.13%) |
242.00 |
228.16 - 245.99 |
0.9789 times |

DMA SMA EMA moving averages of Resmed Inc RMD
DMA (daily moving average) of Resmed Inc RMD
| DMA period | DMA value | | 5 day DMA | 251.59 | | 12 day DMA | 250.43 | | 20 day DMA | 250.15 | | 35 day DMA | 253.69 | | 50 day DMA | 259.78 | | 100 day DMA | 267.51 | | 150 day DMA | 261.32 | | 200 day DMA | 251.71 | EMA (exponential moving average) of Resmed Inc RMD
| EMA period | EMA current | EMA prev | EMA prev2 | | 5 day EMA | 251.46 | 251.45 | 251.45 | | 12 day EMA | 251.13 | 251.07 | 251 | | 20 day EMA | 251.79 | 251.82 | 251.86 | | 35 day EMA | 255.74 | 255.99 | 256.26 | | 50 day EMA | 259.99 | 260.34 | 260.7 |
SMA (simple moving average) of Resmed Inc RMD
| SMA period | SMA current | SMA prev | SMA prev2 | | 5 day SMA | 251.59 | 252.31 | 253.18 | | 12 day SMA | 250.43 | 249.87 | 249.29 | | 20 day SMA | 250.15 | 249.84 | 249.59 | | 35 day SMA | 253.69 | 254.21 | 254.74 | | 50 day SMA | 259.78 | 260.22 | 260.65 | | 100 day SMA | 267.51 | 267.58 | 267.62 | | 150 day SMA | 261.32 | 261.22 | 261.12 | | 200 day SMA | 251.71 | 251.63 | 251.56 |
|
|
