ReinsuranceGroup RGA full analysis,charts,indicators,moving averages,SMA,DMA,EMA,ADX,MACD,RSIReinsurance Group RGA WideScreen charts, DMA,SMA,EMA technical analysis, forecast prediction, by indicators ADX,MACD,RSI,CCI NYSE stock exchange
operates under Finance sector & deals in Life Insurance
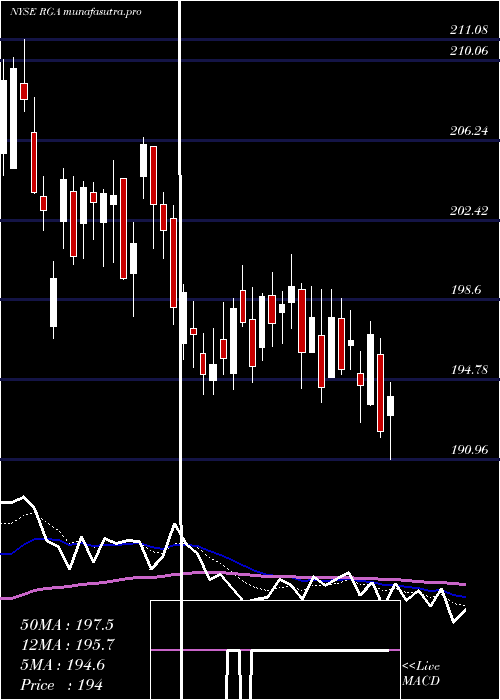
Daily price and charts and targets ReinsuranceGroup Strong Daily Stock price targets for ReinsuranceGroup RGA are 190.45 and 195.35 | Daily Target 1 | 186.46 | | Daily Target 2 | 189.54 | | Daily Target 3 | 191.36333333333 | | Daily Target 4 | 194.44 | | Daily Target 5 | 196.26 |
Daily price and volume Reinsurance Group
| Date |
Closing |
Open |
Range |
Volume |
Thu 04 December 2025 |
192.61 (1.74%) |
188.29 |
188.29 - 193.19 |
1.3541 times |
Wed 03 December 2025 |
189.32 (-1.71%) |
192.40 |
188.95 - 194.50 |
1.287 times |
Tue 02 December 2025 |
192.62 (-0.04%) |
193.15 |
191.30 - 193.43 |
1.0524 times |
Mon 01 December 2025 |
192.69 (1.49%) |
190.07 |
189.63 - 193.47 |
1.066 times |
Fri 28 November 2025 |
189.87 (-0.47%) |
189.62 |
188.94 - 191.97 |
0.4131 times |
Wed 26 November 2025 |
190.76 (0.43%) |
190.17 |
189.96 - 192.62 |
0.8037 times |
Tue 25 November 2025 |
189.95 (1.46%) |
188.78 |
187.72 - 191.19 |
1.3239 times |
Mon 24 November 2025 |
187.22 (0.03%) |
186.21 |
185.12 - 187.49 |
1.1515 times |
Fri 21 November 2025 |
187.16 (1.27%) |
186.44 |
184.78 - 188.99 |
0.7317 times |
Thu 20 November 2025 |
184.81 (-1.63%) |
189.21 |
184.34 - 190.92 |
0.8165 times |
Wed 19 November 2025 |
187.87 (0.63%) |
187.08 |
185.52 - 191.00 |
1.2097 times |
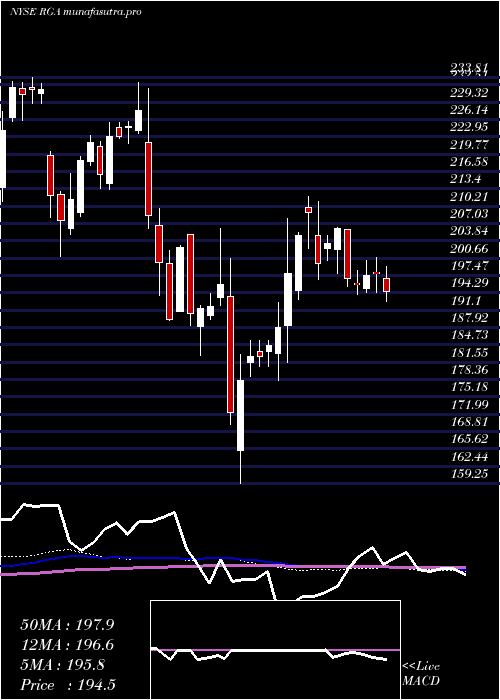
Weekly price and charts ReinsuranceGroup Strong weekly Stock price targets for ReinsuranceGroup RGA are 190.45 and 196.66 | Weekly Target 1 | 185.59 | | Weekly Target 2 | 189.1 | | Weekly Target 3 | 191.8 | | Weekly Target 4 | 195.31 | | Weekly Target 5 | 198.01 |
Weekly price and volumes for Reinsurance Group
| Date |
Closing |
Open |
Range |
Volume |
Thu 04 December 2025 |
192.61 (1.44%) |
190.07 |
188.29 - 194.50 |
1.0616 times |
Fri 28 November 2025 |
189.87 (1.45%) |
186.21 |
185.12 - 192.62 |
0.8236 times |
Fri 21 November 2025 |
187.16 (-0.82%) |
189.36 |
182.73 - 191.00 |
0.9651 times |
Fri 14 November 2025 |
188.71 (-0.91%) |
189.75 |
185.77 - 191.90 |
0.7773 times |
Fri 07 November 2025 |
190.44 (4.37%) |
180.66 |
180.18 - 192.21 |
1.1898 times |
Fri 31 October 2025 |
182.46 (0%) |
184.10 |
178.21 - 192.67 |
0.6528 times |
Fri 31 October 2025 |
182.46 (-3.67%) |
190.45 |
178.21 - 192.67 |
1.7179 times |
Fri 24 October 2025 |
189.42 (0.89%) |
189.29 |
186.84 - 191.01 |
0.8385 times |
Fri 17 October 2025 |
187.74 (-2.21%) |
192.06 |
183.02 - 198.02 |
1.0463 times |
Fri 10 October 2025 |
191.99 (-2.77%) |
197.89 |
191.64 - 200.41 |
0.9271 times |
Fri 03 October 2025 |
197.46 (3.35%) |
191.11 |
189.10 - 198.77 |
0.92 times |
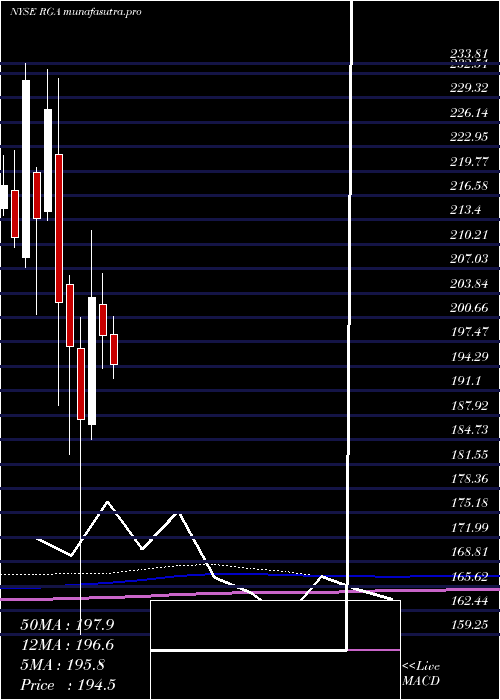
Monthly price and charts ReinsuranceGroup Strong monthly Stock price targets for ReinsuranceGroup RGA are 190.45 and 196.66 | Monthly Target 1 | 185.59 | | Monthly Target 2 | 189.1 | | Monthly Target 3 | 191.8 | | Monthly Target 4 | 195.31 | | Monthly Target 5 | 198.01 |
Monthly price and volumes Reinsurance Group
| Date |
Closing |
Open |
Range |
Volume |
Thu 04 December 2025 |
192.61 (1.44%) |
190.07 |
188.29 - 194.50 |
0.2299 times |
Fri 28 November 2025 |
189.87 (4.06%) |
180.66 |
180.18 - 192.62 |
0.8135 times |
Fri 31 October 2025 |
182.46 (-5.03%) |
191.27 |
178.21 - 200.41 |
1.2491 times |
Tue 30 September 2025 |
192.13 (-1.37%) |
193.74 |
183.36 - 199.00 |
1.3957 times |
Fri 29 August 2025 |
194.79 (1.22%) |
176.16 |
165.52 - 195.94 |
1.2215 times |
Thu 31 July 2025 |
192.45 (-2.98%) |
198.47 |
189.27 - 200.78 |
0.9423 times |
Mon 30 June 2025 |
198.36 (-2.43%) |
202.31 |
194.06 - 206.39 |
0.8491 times |
Fri 30 May 2025 |
203.29 (8.53%) |
186.74 |
184.80 - 211.96 |
1.0974 times |
Wed 30 April 2025 |
187.31 (-4.87%) |
196.63 |
159.25 - 200.65 |
1.1087 times |
Mon 31 March 2025 |
196.90 (-2.86%) |
204.97 |
182.78 - 206.13 |
1.0927 times |
Fri 28 February 2025 |
202.69 (-11.05%) |
221.95 |
189.21 - 231.92 |
1.624 times |
DMA SMA EMA moving averages of Reinsurance Group RGA
DMA (daily moving average) of Reinsurance Group RGA
| DMA period | DMA value | | 5 day DMA | 191.42 | | 12 day DMA | 189.3 | | 20 day DMA | 188.96 | | 35 day DMA | 188.41 | | 50 day DMA | 190.06 | | 100 day DMA | 190.5 | | 150 day DMA | 193.67 | | 200 day DMA | 192.71 | EMA (exponential moving average) of Reinsurance Group RGA
| EMA period | EMA current | EMA prev | EMA prev2 | | 5 day EMA | 191.21 | 190.51 | 191.11 | | 12 day EMA | 190.04 | 189.57 | 189.62 | | 20 day EMA | 189.46 | 189.13 | 189.11 | | 35 day EMA | 189.67 | 189.5 | 189.51 | | 50 day EMA | 190.05 | 189.95 | 189.98 |
SMA (simple moving average) of Reinsurance Group RGA
| SMA period | SMA current | SMA prev | SMA prev2 | | 5 day SMA | 191.42 | 191.05 | 191.18 | | 12 day SMA | 189.3 | 188.59 | 188.54 | | 20 day SMA | 188.96 | 188.7 | 188.57 | | 35 day SMA | 188.41 | 188.4 | 188.62 | | 50 day SMA | 190.06 | 190.03 | 190 | | 100 day SMA | 190.5 | 190.49 | 190.57 | | 150 day SMA | 193.67 | 193.64 | 193.66 | | 200 day SMA | 192.71 | 192.74 | 192.82 |
|
|
