RafaelHoldings RFL full analysis,charts,indicators,moving averages,SMA,DMA,EMA,ADX,MACD,RSIRafael Holdings RFL WideScreen charts, DMA,SMA,EMA technical analysis, forecast prediction, by indicators ADX,MACD,RSI,CCI NYSE stock exchange
Daily price and charts and targets RafaelHoldings Strong Daily Stock price targets for RafaelHoldings RFL are 1.2 and 1.25 | Daily Target 1 | 1.18 | | Daily Target 2 | 1.21 | | Daily Target 3 | 1.2333333333333 | | Daily Target 4 | 1.26 | | Daily Target 5 | 1.28 |
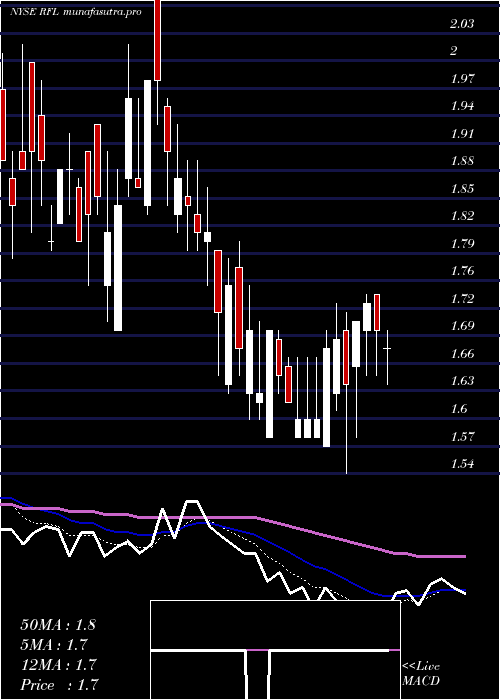
Daily price and volume Rafael Holdings
| Date |
Closing |
Open |
Range |
Volume |
Fri 05 December 2025 |
1.23 (0.82%) |
1.25 |
1.21 - 1.26 |
0.4568 times |
Thu 04 December 2025 |
1.22 (-2.4%) |
1.24 |
1.22 - 1.26 |
0.4543 times |
Wed 03 December 2025 |
1.25 (1.63%) |
1.23 |
1.20 - 1.25 |
0.881 times |
Tue 02 December 2025 |
1.23 (0.82%) |
1.29 |
1.23 - 1.29 |
0.8923 times |
Mon 01 December 2025 |
1.22 (3.39%) |
1.19 |
1.19 - 1.26 |
1.8559 times |
Fri 28 November 2025 |
1.18 (-3.28%) |
1.22 |
1.18 - 1.24 |
1.2652 times |
Wed 26 November 2025 |
1.22 (0.83%) |
1.19 |
1.17 - 1.26 |
2.6055 times |
Tue 25 November 2025 |
1.21 (-2.42%) |
1.24 |
1.20 - 1.24 |
0.2425 times |
Mon 24 November 2025 |
1.24 (0%) |
1.24 |
1.22 - 1.24 |
0.4968 times |
Fri 21 November 2025 |
1.24 (0%) |
1.28 |
1.19 - 1.28 |
0.8497 times |
Thu 20 November 2025 |
1.24 (0%) |
1.27 |
1.20 - 1.28 |
0.866 times |
Weekly price and charts RafaelHoldings Strong weekly Stock price targets for RafaelHoldings RFL are 1.21 and 1.31 | Weekly Target 1 | 1.14 | | Weekly Target 2 | 1.18 | | Weekly Target 3 | 1.2366666666667 | | Weekly Target 4 | 1.28 | | Weekly Target 5 | 1.34 |
Weekly price and volumes for Rafael Holdings
| Date |
Closing |
Open |
Range |
Volume |
Fri 05 December 2025 |
1.23 (4.24%) |
1.19 |
1.19 - 1.29 |
0.9964 times |
Fri 28 November 2025 |
1.18 (-4.84%) |
1.24 |
1.17 - 1.26 |
1.0117 times |
Fri 21 November 2025 |
1.24 (1.64%) |
1.23 |
1.19 - 1.29 |
1.1082 times |
Fri 14 November 2025 |
1.22 (-5.43%) |
1.29 |
1.20 - 1.32 |
1.5987 times |
Fri 07 November 2025 |
1.29 (-5.15%) |
1.31 |
1.22 - 1.36 |
1.0329 times |
Fri 31 October 2025 |
1.36 (0%) |
1.36 |
1.31 - 1.37 |
0.2538 times |
Fri 31 October 2025 |
1.36 (0.74%) |
1.34 |
1.31 - 1.38 |
1.0527 times |
Fri 24 October 2025 |
1.35 (2.27%) |
1.35 |
1.32 - 1.44 |
0.7503 times |
Fri 17 October 2025 |
1.32 (0.76%) |
1.41 |
1.30 - 1.41 |
1.5196 times |
Tue 07 October 2025 |
1.31 (-2.96%) |
1.38 |
1.31 - 1.40 |
0.6758 times |
Fri 03 October 2025 |
1.35 (-0.74%) |
1.40 |
1.34 - 1.47 |
0.9713 times |

Monthly price and charts RafaelHoldings Strong monthly Stock price targets for RafaelHoldings RFL are 1.21 and 1.31 | Monthly Target 1 | 1.14 | | Monthly Target 2 | 1.18 | | Monthly Target 3 | 1.2366666666667 | | Monthly Target 4 | 1.28 | | Monthly Target 5 | 1.34 |
Monthly price and volumes Rafael Holdings
| Date |
Closing |
Open |
Range |
Volume |
Fri 05 December 2025 |
1.23 (4.24%) |
1.19 |
1.19 - 1.29 |
0.1323 times |
Fri 28 November 2025 |
1.18 (-13.24%) |
1.31 |
1.17 - 1.36 |
0.6311 times |
Fri 31 October 2025 |
1.36 (0%) |
1.40 |
1.30 - 1.45 |
0.6322 times |
Tue 30 September 2025 |
1.36 (-7.48%) |
1.38 |
1.29 - 1.70 |
1.4666 times |
Fri 29 August 2025 |
1.47 (-13.02%) |
1.66 |
1.41 - 1.92 |
0.5282 times |
Thu 31 July 2025 |
1.69 (-2.31%) |
1.81 |
1.69 - 2.65 |
1.6175 times |
Mon 30 June 2025 |
1.73 (20.98%) |
1.46 |
1.41 - 3.19 |
3.1816 times |
Fri 30 May 2025 |
1.43 (-9.49%) |
1.57 |
1.28 - 1.64 |
1.0442 times |
Wed 30 April 2025 |
1.58 (-15.51%) |
1.85 |
1.54 - 1.89 |
0.5945 times |
Mon 31 March 2025 |
1.87 (-7.43%) |
1.97 |
1.70 - 2.10 |
0.1718 times |
Fri 28 February 2025 |
2.02 (-1.94%) |
2.05 |
1.86 - 2.12 |
0.1929 times |

DMA SMA EMA moving averages of Rafael Holdings RFL
DMA (daily moving average) of Rafael Holdings RFL
| DMA period | DMA value | | 5 day DMA | 1.23 | | 12 day DMA | 1.23 | | 20 day DMA | 1.24 | | 35 day DMA | 1.29 | | 50 day DMA | 1.31 | | 100 day DMA | 1.49 | | 150 day DMA | 1.54 | | 200 day DMA | 1.62 | EMA (exponential moving average) of Rafael Holdings RFL
| EMA period | EMA current | EMA prev | EMA prev2 | | 5 day EMA | 1.23 | 1.23 | 1.23 | | 12 day EMA | 1.24 | 1.24 | 1.24 | | 20 day EMA | 1.26 | 1.26 | 1.26 | | 35 day EMA | 1.29 | 1.29 | 1.29 | | 50 day EMA | 1.33 | 1.33 | 1.33 |
SMA (simple moving average) of Rafael Holdings RFL
| SMA period | SMA current | SMA prev | SMA prev2 | | 5 day SMA | 1.23 | 1.22 | 1.22 | | 12 day SMA | 1.23 | 1.23 | 1.23 | | 20 day SMA | 1.24 | 1.24 | 1.25 | | 35 day SMA | 1.29 | 1.29 | 1.29 | | 50 day SMA | 1.31 | 1.31 | 1.32 | | 100 day SMA | 1.49 | 1.5 | 1.51 | | 150 day SMA | 1.54 | 1.55 | 1.55 | | 200 day SMA | 1.62 | 1.62 | 1.63 |
|
|
