RegionsFinancial RF-C full analysis,charts,indicators,moving averages,SMA,DMA,EMA,ADX,MACD,RSIRegions Financial RF-C WideScreen charts, DMA,SMA,EMA technical analysis, forecast prediction, by indicators ADX,MACD,RSI,CCI NYSE stock exchange
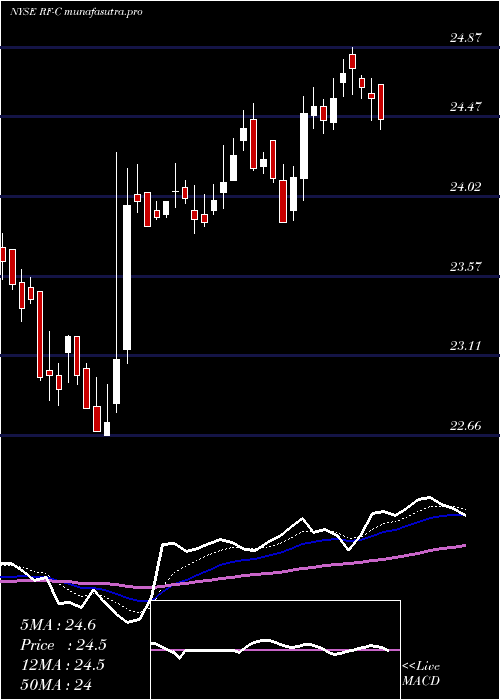
Daily price and charts and targets RegionsFinancial Strong Daily Stock price targets for RegionsFinancial RF-C are 24.61 and 24.86 | Daily Target 1 | 24.41 | | Daily Target 2 | 24.55 | | Daily Target 3 | 24.656666666667 | | Daily Target 4 | 24.8 | | Daily Target 5 | 24.91 |
Daily price and volume Regions Financial
| Date |
Closing |
Open |
Range |
Volume |
Mon 20 October 2025 |
24.70 (1.02%) |
24.51 |
24.51 - 24.76 |
0.681 times |
Fri 17 October 2025 |
24.45 (0.95%) |
24.41 |
24.22 - 24.65 |
0.8318 times |
Thu 16 October 2025 |
24.22 (-1.74%) |
24.80 |
24.04 - 24.80 |
1.5539 times |
Wed 15 October 2025 |
24.65 (0%) |
24.65 |
24.53 - 24.83 |
0.681 times |
Tue 14 October 2025 |
24.65 (0%) |
24.63 |
24.55 - 24.75 |
0.8684 times |
Mon 13 October 2025 |
24.65 (0.33%) |
24.70 |
24.50 - 24.75 |
0.8455 times |
Fri 10 October 2025 |
24.57 (-0.41%) |
24.71 |
24.45 - 24.76 |
1.1654 times |
Thu 09 October 2025 |
24.67 (-0.12%) |
24.68 |
24.56 - 24.82 |
1.0329 times |
Wed 08 October 2025 |
24.70 (-0.28%) |
24.69 |
24.68 - 24.82 |
1.1289 times |
Tue 07 October 2025 |
24.77 (0.2%) |
24.60 |
24.60 - 24.85 |
1.2112 times |
Mon 06 October 2025 |
24.72 (0.82%) |
24.43 |
24.38 - 24.74 |
0.7815 times |
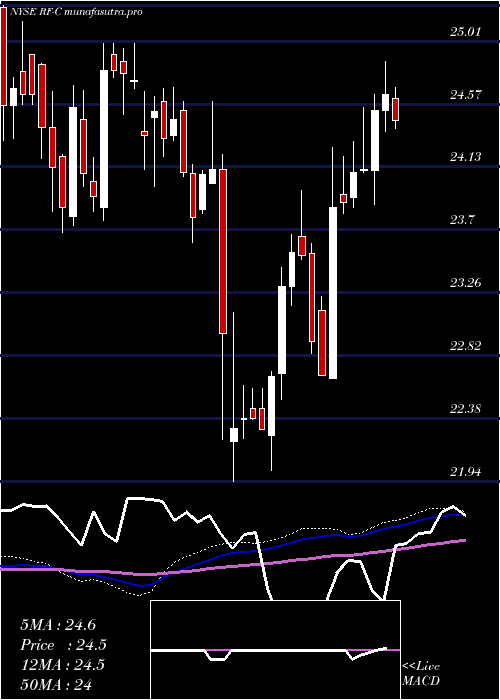
Weekly price and charts RegionsFinancial Strong weekly Stock price targets for RegionsFinancial RF-C are 24.61 and 24.86 | Weekly Target 1 | 24.41 | | Weekly Target 2 | 24.55 | | Weekly Target 3 | 24.656666666667 | | Weekly Target 4 | 24.8 | | Weekly Target 5 | 24.91 |
Weekly price and volumes for Regions Financial
| Date |
Closing |
Open |
Range |
Volume |
Mon 20 October 2025 |
24.70 (1.02%) |
24.51 |
24.51 - 24.76 |
0.1188 times |
Fri 17 October 2025 |
24.45 (-0.49%) |
24.70 |
24.04 - 24.83 |
0.8343 times |
Fri 10 October 2025 |
24.57 (0.2%) |
24.43 |
24.38 - 24.85 |
0.9285 times |
Fri 03 October 2025 |
24.52 (-0.28%) |
24.59 |
24.33 - 24.77 |
1.1135 times |
Fri 26 September 2025 |
24.59 (-1.09%) |
24.88 |
24.51 - 25.10 |
0.9125 times |
Fri 19 September 2025 |
24.86 (0.28%) |
24.71 |
24.66 - 24.90 |
0.867 times |
Fri 12 September 2025 |
24.79 (2.52%) |
24.30 |
24.12 - 24.86 |
1.4038 times |
Fri 05 September 2025 |
24.18 (1.09%) |
23.94 |
23.90 - 24.34 |
0.9468 times |
Fri 29 August 2025 |
23.92 (0%) |
24.08 |
23.81 - 24.08 |
0.8439 times |
Fri 29 August 2025 |
23.92 (-2.49%) |
24.63 |
23.81 - 24.63 |
2.0308 times |
Fri 22 August 2025 |
24.53 (-0.69%) |
24.75 |
24.49 - 24.79 |
1.2316 times |
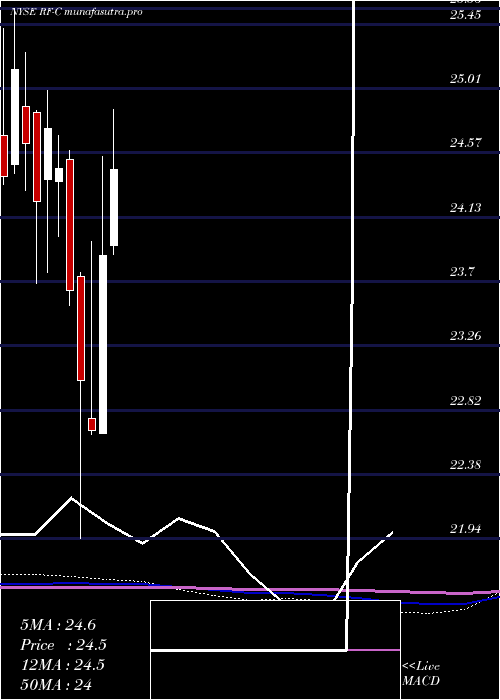
Monthly price and charts RegionsFinancial Strong monthly Stock price targets for RegionsFinancial RF-C are 24.37 and 25.18 | Monthly Target 1 | 23.72 | | Monthly Target 2 | 24.21 | | Monthly Target 3 | 24.53 | | Monthly Target 4 | 25.02 | | Monthly Target 5 | 25.34 |
Monthly price and volumes Regions Financial
| Date |
Closing |
Open |
Range |
Volume |
Mon 20 October 2025 |
24.70 (0.86%) |
24.40 |
24.04 - 24.85 |
0.35 times |
Tue 30 September 2025 |
24.49 (2.38%) |
23.94 |
23.90 - 25.10 |
0.759 times |
Fri 29 August 2025 |
23.92 (-3.82%) |
24.59 |
23.81 - 24.79 |
0.952 times |
Thu 31 July 2025 |
24.87 (4.19%) |
23.94 |
23.88 - 25.58 |
1.1355 times |
Mon 30 June 2025 |
23.87 (5.25%) |
22.66 |
22.66 - 24.55 |
1.86 times |
Fri 30 May 2025 |
22.68 (-1.48%) |
22.76 |
22.65 - 23.97 |
0.9032 times |
Wed 30 April 2025 |
23.02 (-2.58%) |
23.73 |
21.94 - 23.76 |
1.0835 times |
Mon 31 March 2025 |
23.63 (-3.43%) |
24.53 |
23.53 - 24.59 |
0.8926 times |
Fri 28 February 2025 |
24.47 (-1.09%) |
24.38 |
24.00 - 24.69 |
0.613 times |
Fri 31 January 2025 |
24.74 (2.06%) |
24.39 |
23.76 - 25.00 |
1.4511 times |
Tue 31 December 2024 |
24.24 (-1.62%) |
24.85 |
23.68 - 24.86 |
1.1417 times |
DMA SMA EMA moving averages of Regions Financial RF-C
DMA (daily moving average) of Regions Financial RF-C
| DMA period | DMA value | | 5 day DMA | 24.53 | | 12 day DMA | 24.61 | | 20 day DMA | 24.64 | | 35 day DMA | 24.57 | | 50 day DMA | 24.54 | | 100 day DMA | 24.36 | | 150 day DMA | 23.98 | | 200 day DMA | 24.08 | EMA (exponential moving average) of Regions Financial RF-C
| EMA period | EMA current | EMA prev | EMA prev2 | | 5 day EMA | 24.55 | 24.48 | 24.5 | | 12 day EMA | 24.58 | 24.56 | 24.58 | | 20 day EMA | 24.59 | 24.58 | 24.59 | | 35 day EMA | 24.57 | 24.56 | 24.57 | | 50 day EMA | 24.54 | 24.53 | 24.53 |
SMA (simple moving average) of Regions Financial RF-C
| SMA period | SMA current | SMA prev | SMA prev2 | | 5 day SMA | 24.53 | 24.52 | 24.55 | | 12 day SMA | 24.61 | 24.58 | 24.58 | | 20 day SMA | 24.64 | 24.64 | 24.66 | | 35 day SMA | 24.57 | 24.54 | 24.53 | | 50 day SMA | 24.54 | 24.54 | 24.54 | | 100 day SMA | 24.36 | 24.35 | 24.33 | | 150 day SMA | 23.98 | 23.97 | 23.97 | | 200 day SMA | 24.08 | 24.08 | 24.08 |
|
|
