RegionsFinancial RF full analysis,charts,indicators,moving averages,SMA,DMA,EMA,ADX,MACD,RSIRegions Financial RF WideScreen charts, DMA,SMA,EMA technical analysis, forecast prediction, by indicators ADX,MACD,RSI,CCI NYSE stock exchange
operates under Finance sector & deals in Major Banks
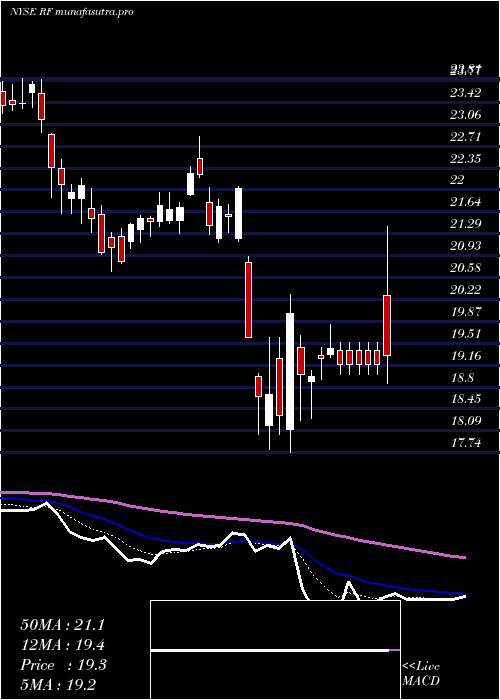
Daily price and charts and targets RegionsFinancial Strong Daily Stock price targets for RegionsFinancial RF are 26.25 and 26.79 | Daily Target 1 | 25.84 | | Daily Target 2 | 26.12 | | Daily Target 3 | 26.376666666667 | | Daily Target 4 | 26.66 | | Daily Target 5 | 26.92 |
Daily price and volume Regions Financial
| Date |
Closing |
Open |
Range |
Volume |
Thu 04 December 2025 |
26.41 (0.8%) |
26.17 |
26.09 - 26.63 |
0.8777 times |
Wed 03 December 2025 |
26.20 (3.11%) |
25.49 |
25.41 - 26.24 |
1.0964 times |
Tue 02 December 2025 |
25.41 (0.32%) |
25.51 |
25.31 - 25.62 |
0.8855 times |
Mon 01 December 2025 |
25.33 (-0.47%) |
25.00 |
24.88 - 25.69 |
1.0788 times |
Fri 28 November 2025 |
25.45 (0%) |
25.46 |
25.43 - 25.59 |
0.35 times |
Wed 26 November 2025 |
25.45 (0.12%) |
25.37 |
25.31 - 25.68 |
0.9362 times |
Tue 25 November 2025 |
25.42 (2.29%) |
25.08 |
25.01 - 25.55 |
0.9855 times |
Mon 24 November 2025 |
24.85 (-0.24%) |
24.88 |
24.65 - 24.97 |
1.0368 times |
Fri 21 November 2025 |
24.91 (3.36%) |
24.24 |
24.23 - 25.08 |
1.2691 times |
Thu 20 November 2025 |
24.10 (-0.5%) |
24.50 |
24.03 - 24.75 |
1.4839 times |
Wed 19 November 2025 |
24.22 (0.17%) |
24.17 |
24.06 - 24.40 |
1.415 times |
Weekly price and charts RegionsFinancial Strong weekly Stock price targets for RegionsFinancial RF are 25.65 and 27.4 | Weekly Target 1 | 24.22 | | Weekly Target 2 | 25.32 | | Weekly Target 3 | 25.973333333333 | | Weekly Target 4 | 27.07 | | Weekly Target 5 | 27.72 |
Weekly price and volumes for Regions Financial
| Date |
Closing |
Open |
Range |
Volume |
Thu 04 December 2025 |
26.41 (3.77%) |
25.00 |
24.88 - 26.63 |
0.4039 times |
Fri 28 November 2025 |
25.45 (2.17%) |
24.88 |
24.65 - 25.68 |
0.3393 times |
Fri 21 November 2025 |
24.91 (-0.2%) |
24.92 |
23.59 - 25.08 |
0.7898 times |
Fri 14 November 2025 |
24.96 (0.44%) |
25.00 |
24.60 - 25.69 |
0.7991 times |
Fri 07 November 2025 |
24.85 (2.69%) |
24.08 |
23.89 - 24.86 |
0.8827 times |
Fri 31 October 2025 |
24.20 (0%) |
24.04 |
23.86 - 24.30 |
0.2147 times |
Fri 31 October 2025 |
24.20 (-1.51%) |
24.66 |
23.86 - 24.70 |
1.7354 times |
Fri 24 October 2025 |
24.57 (4.2%) |
23.68 |
23.66 - 24.64 |
2.339 times |
Fri 17 October 2025 |
23.58 (-8.36%) |
24.58 |
22.70 - 25.31 |
2.0259 times |
Tue 07 October 2025 |
25.73 (-2.5%) |
26.36 |
25.72 - 26.87 |
0.4701 times |
Fri 03 October 2025 |
26.39 (-0.9%) |
26.72 |
25.89 - 26.78 |
0.9985 times |
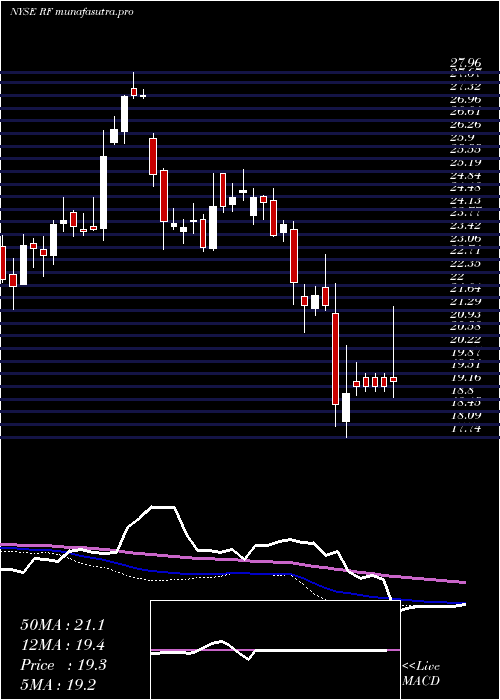
Monthly price and charts RegionsFinancial Strong monthly Stock price targets for RegionsFinancial RF are 25.65 and 27.4 | Monthly Target 1 | 24.22 | | Monthly Target 2 | 25.32 | | Monthly Target 3 | 25.973333333333 | | Monthly Target 4 | 27.07 | | Monthly Target 5 | 27.72 |
Monthly price and volumes Regions Financial
| Date |
Closing |
Open |
Range |
Volume |
Thu 04 December 2025 |
26.41 (3.77%) |
25.00 |
24.88 - 26.63 |
0.1497 times |
Fri 28 November 2025 |
25.45 (5.17%) |
24.08 |
23.59 - 25.69 |
1.0416 times |
Fri 31 October 2025 |
24.20 (-8.23%) |
26.30 |
22.70 - 26.87 |
2.7261 times |
Tue 30 September 2025 |
26.37 (-3.72%) |
26.77 |
25.90 - 27.61 |
1.3931 times |
Fri 29 August 2025 |
27.39 (8.13%) |
24.91 |
24.40 - 27.58 |
1.1159 times |
Thu 31 July 2025 |
25.33 (7.7%) |
23.35 |
23.35 - 26.66 |
1.044 times |
Mon 30 June 2025 |
23.52 (9.7%) |
21.19 |
20.79 - 23.67 |
0.6517 times |
Fri 30 May 2025 |
21.44 (5.05%) |
20.33 |
20.18 - 22.68 |
0.4752 times |
Wed 30 April 2025 |
20.41 (-6.07%) |
21.60 |
17.74 - 22.05 |
0.7375 times |
Mon 31 March 2025 |
21.73 (-8.35%) |
23.56 |
20.68 - 23.78 |
0.6652 times |
Fri 28 February 2025 |
23.71 (-3.77%) |
23.94 |
23.21 - 24.71 |
0.4597 times |

DMA SMA EMA moving averages of Regions Financial RF
DMA (daily moving average) of Regions Financial RF
| DMA period | DMA value | | 5 day DMA | 25.76 | | 12 day DMA | 25.16 | | 20 day DMA | 25.04 | | 35 day DMA | 24.65 | | 50 day DMA | 25.07 | | 100 day DMA | 25.6 | | 150 day DMA | 24.46 | | 200 day DMA | 23.65 | EMA (exponential moving average) of Regions Financial RF
| EMA period | EMA current | EMA prev | EMA prev2 | | 5 day EMA | 25.87 | 25.6 | 25.3 | | 12 day EMA | 25.41 | 25.23 | 25.05 | | 20 day EMA | 25.2 | 25.07 | 24.95 | | 35 day EMA | 25.22 | 25.15 | 25.09 | | 50 day EMA | 25.31 | 25.26 | 25.22 |
SMA (simple moving average) of Regions Financial RF
| SMA period | SMA current | SMA prev | SMA prev2 | | 5 day SMA | 25.76 | 25.57 | 25.41 | | 12 day SMA | 25.16 | 24.99 | 24.88 | | 20 day SMA | 25.04 | 24.94 | 24.84 | | 35 day SMA | 24.65 | 24.6 | 24.57 | | 50 day SMA | 25.07 | 25.09 | 25.11 | | 100 day SMA | 25.6 | 25.58 | 25.57 | | 150 day SMA | 24.46 | 24.42 | 24.38 | | 200 day SMA | 23.65 | 23.64 | 23.63 |
|
|
