RexfordIndl REX-C full analysis,charts,indicators,moving averages,SMA,DMA,EMA,ADX,MACD,RSIRexford Indl REX-C WideScreen charts, DMA,SMA,EMA technical analysis, forecast prediction, by indicators ADX,MACD,RSI,CCI NYSE stock exchange
Daily price and charts and targets RexfordIndl Strong Daily Stock price targets for RexfordIndl REX-C are 21.42 and 21.54 | Daily Target 1 | 21.33 | | Daily Target 2 | 21.39 | | Daily Target 3 | 21.446666666667 | | Daily Target 4 | 21.51 | | Daily Target 5 | 21.57 |
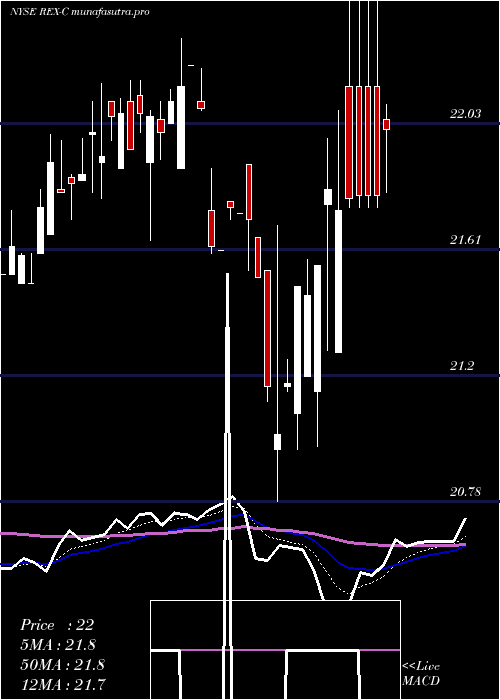
Daily price and volume Rexford Indl
| Date |
Closing |
Open |
Range |
Volume |
Thu 04 December 2025 |
21.46 (0.19%) |
21.43 |
21.38 - 21.50 |
1.0417 times |
Wed 03 December 2025 |
21.42 (-0.37%) |
21.47 |
21.35 - 21.47 |
3.5417 times |
Tue 02 December 2025 |
21.50 (-1.51%) |
21.70 |
21.50 - 21.77 |
1.1458 times |
Mon 01 December 2025 |
21.83 (-0.64%) |
21.90 |
21.78 - 21.90 |
0.4167 times |
Wed 26 November 2025 |
21.97 (1.48%) |
21.97 |
21.97 - 21.97 |
0.1563 times |
Tue 25 November 2025 |
21.65 (-0.18%) |
21.65 |
21.65 - 21.65 |
0.1563 times |
Mon 24 November 2025 |
21.69 (0.09%) |
21.62 |
21.62 - 21.77 |
0.6771 times |
Fri 21 November 2025 |
21.67 (0.79%) |
21.39 |
21.39 - 21.67 |
0.8333 times |
Thu 20 November 2025 |
21.50 (0.14%) |
21.41 |
21.41 - 21.73 |
1.4583 times |
Wed 19 November 2025 |
21.47 (0.99%) |
21.26 |
21.26 - 21.55 |
0.5729 times |
Tue 18 November 2025 |
21.26 (-2.07%) |
21.60 |
21.22 - 21.60 |
2.5 times |
Weekly price and charts RexfordIndl Strong weekly Stock price targets for RexfordIndl REX-C are 21.13 and 21.68 | Weekly Target 1 | 21.02 | | Weekly Target 2 | 21.24 | | Weekly Target 3 | 21.57 | | Weekly Target 4 | 21.79 | | Weekly Target 5 | 22.12 |
Weekly price and volumes for Rexford Indl
| Date |
Closing |
Open |
Range |
Volume |
Thu 04 December 2025 |
21.46 (-2.32%) |
21.90 |
21.35 - 21.90 |
1.8438 times |
Wed 26 November 2025 |
21.97 (1.38%) |
21.62 |
21.62 - 21.97 |
0.2969 times |
Fri 21 November 2025 |
21.67 (0.84%) |
21.71 |
21.22 - 21.73 |
1.7188 times |
Fri 14 November 2025 |
21.49 (-1.56%) |
21.80 |
21.45 - 21.90 |
1.1406 times |
Fri 07 November 2025 |
21.83 (-1.09%) |
21.90 |
21.15 - 22.28 |
1.0156 times |
Fri 31 October 2025 |
22.07 (0%) |
22.10 |
22.07 - 22.14 |
0.2344 times |
Fri 31 October 2025 |
22.07 (-0.85%) |
22.17 |
21.90 - 22.17 |
0.9531 times |
Fri 24 October 2025 |
22.26 (-0.18%) |
22.11 |
22.00 - 22.45 |
1.0625 times |
Fri 17 October 2025 |
22.30 (-0.62%) |
22.27 |
21.96 - 22.54 |
0.7344 times |
Fri 10 October 2025 |
22.44 (-0.27%) |
22.40 |
22.18 - 22.65 |
1 times |
Fri 03 October 2025 |
22.50 (-2.17%) |
23.00 |
22.15 - 23.00 |
1.8125 times |

Monthly price and charts RexfordIndl Strong monthly Stock price targets for RexfordIndl REX-C are 21.13 and 21.68 | Monthly Target 1 | 21.02 | | Monthly Target 2 | 21.24 | | Monthly Target 3 | 21.57 | | Monthly Target 4 | 21.79 | | Monthly Target 5 | 22.12 |
Monthly price and volumes Rexford Indl
| Date |
Closing |
Open |
Range |
Volume |
Thu 04 December 2025 |
21.46 (-2.32%) |
21.90 |
21.35 - 21.90 |
0.2079 times |
Wed 26 November 2025 |
21.97 (-0.45%) |
21.90 |
21.15 - 22.28 |
0.4703 times |
Fri 31 October 2025 |
22.07 (-3.12%) |
22.83 |
21.90 - 22.83 |
0.4897 times |
Tue 30 September 2025 |
22.78 (1.47%) |
22.05 |
22.03 - 23.33 |
1.3686 times |
Fri 29 August 2025 |
22.45 (4.42%) |
21.55 |
21.55 - 22.49 |
0.6782 times |
Wed 30 July 2025 |
21.50 (1.56%) |
21.23 |
20.93 - 21.98 |
1.1899 times |
Mon 30 June 2025 |
21.17 (-1.72%) |
21.35 |
20.81 - 22.00 |
0.6095 times |
Thu 29 May 2025 |
21.54 (-2.8%) |
22.08 |
20.13 - 22.45 |
0.8719 times |
Wed 30 April 2025 |
22.16 (1.89%) |
21.73 |
20.78 - 22.57 |
1.7193 times |
Mon 31 March 2025 |
21.75 (0%) |
21.66 |
21.60 - 22.31 |
2.3948 times |
Fri 28 February 2025 |
21.75 (0.79%) |
21.69 |
21.38 - 21.81 |
1.1027 times |

DMA SMA EMA moving averages of Rexford Indl REX-C
DMA (daily moving average) of Rexford Indl REX-C
| DMA period | DMA value | | 5 day DMA | 21.64 | | 12 day DMA | 21.59 | | 20 day DMA | 21.67 | | 35 day DMA | 21.86 | | 50 day DMA | 22.1 | | 100 day DMA | 22.16 | | 150 day DMA | 21.97 | | 200 day DMA | 21.91 | EMA (exponential moving average) of Rexford Indl REX-C
| EMA period | EMA current | EMA prev | EMA prev2 | | 5 day EMA | 21.55 | 21.59 | 21.68 | | 12 day EMA | 21.62 | 21.65 | 21.69 | | 20 day EMA | 21.71 | 21.74 | 21.77 | | 35 day EMA | 21.89 | 21.92 | 21.95 | | 50 day EMA | 22.11 | 22.14 | 22.17 |
SMA (simple moving average) of Rexford Indl REX-C
| SMA period | SMA current | SMA prev | SMA prev2 | | 5 day SMA | 21.64 | 21.67 | 21.73 | | 12 day SMA | 21.59 | 21.6 | 21.61 | | 20 day SMA | 21.67 | 21.71 | 21.75 | | 35 day SMA | 21.86 | 21.89 | 21.91 | | 50 day SMA | 22.1 | 22.12 | 22.15 | | 100 day SMA | 22.16 | 22.15 | 22.15 | | 150 day SMA | 21.97 | 21.98 | 21.98 | | 200 day SMA | 21.91 | 21.91 | 21.91 |
|
|
