RpcInc RES full analysis,charts,indicators,moving averages,SMA,DMA,EMA,ADX,MACD,RSIRpc Inc RES WideScreen charts, DMA,SMA,EMA technical analysis, forecast prediction, by indicators ADX,MACD,RSI,CCI NYSE stock exchange
operates under Energy sector & deals in Oilfield Services Equipment
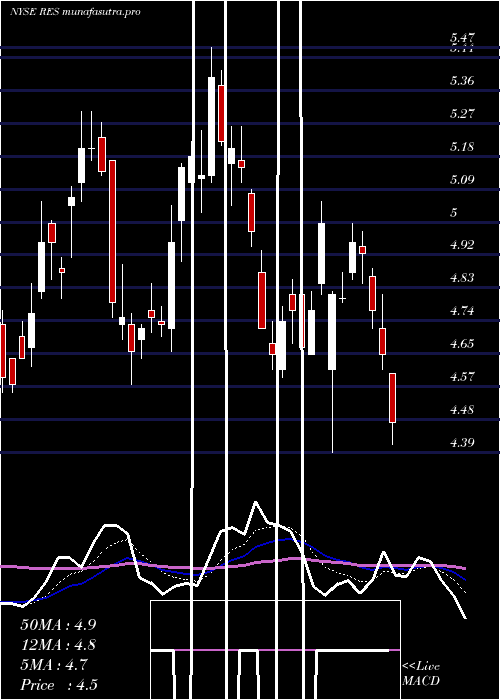
Daily price and charts and targets RpcInc Strong Daily Stock price targets for RpcInc RES are 4.42 and 4.55 | Daily Target 1 | 4.31 | | Daily Target 2 | 4.4 | | Daily Target 3 | 4.4433333333333 | | Daily Target 4 | 4.53 | | Daily Target 5 | 4.57 |
Daily price and volume Rpc Inc
| Date |
Closing |
Open |
Range |
Volume |
Mon 20 October 2025 |
4.48 (3.23%) |
4.36 |
4.36 - 4.49 |
0.8414 times |
Fri 17 October 2025 |
4.34 (0.23%) |
4.31 |
4.24 - 4.40 |
1.1984 times |
Thu 16 October 2025 |
4.33 (0%) |
4.36 |
4.22 - 4.40 |
1.0349 times |
Wed 15 October 2025 |
4.33 (0.23%) |
4.37 |
4.32 - 4.45 |
1.6128 times |
Tue 14 October 2025 |
4.32 (0%) |
4.20 |
4.18 - 4.37 |
0.9429 times |
Mon 13 October 2025 |
4.32 (-9.05%) |
4.30 |
4.18 - 4.35 |
0.9668 times |
Tue 07 October 2025 |
4.75 (-0.84%) |
4.76 |
4.69 - 4.81 |
0.864 times |
Mon 06 October 2025 |
4.79 (0%) |
4.82 |
4.76 - 4.88 |
0.5461 times |
Fri 03 October 2025 |
4.79 (2.57%) |
4.72 |
4.72 - 4.85 |
1.11 times |
Thu 02 October 2025 |
4.67 (-2.3%) |
4.75 |
4.64 - 4.81 |
0.8828 times |
Wed 01 October 2025 |
4.78 (0.42%) |
4.70 |
4.70 - 4.84 |
1.0444 times |
Weekly price and charts RpcInc Strong weekly Stock price targets for RpcInc RES are 4.42 and 4.55 | Weekly Target 1 | 4.31 | | Weekly Target 2 | 4.4 | | Weekly Target 3 | 4.4433333333333 | | Weekly Target 4 | 4.53 | | Weekly Target 5 | 4.57 |
Weekly price and volumes for Rpc Inc
| Date |
Closing |
Open |
Range |
Volume |
Mon 20 October 2025 |
4.48 (3.23%) |
4.36 |
4.36 - 4.49 |
0.2081 times |
Fri 17 October 2025 |
4.34 (-8.63%) |
4.30 |
4.18 - 4.45 |
1.4238 times |
Tue 07 October 2025 |
4.75 (-0.84%) |
4.82 |
4.69 - 4.88 |
0.3488 times |
Fri 03 October 2025 |
4.79 (-1.64%) |
4.81 |
4.64 - 4.85 |
1.2848 times |
Fri 26 September 2025 |
4.87 (7.98%) |
4.46 |
4.41 - 4.96 |
1.2085 times |
Fri 19 September 2025 |
4.51 (0.89%) |
4.52 |
4.46 - 4.71 |
1.5952 times |
Fri 12 September 2025 |
4.47 (-5.5%) |
4.74 |
4.46 - 4.81 |
1.6126 times |
Fri 05 September 2025 |
4.73 (-0.84%) |
4.75 |
4.57 - 4.83 |
1.0519 times |
Fri 29 August 2025 |
4.77 (0%) |
4.74 |
4.73 - 4.81 |
0.1608 times |
Fri 29 August 2025 |
4.77 (0.21%) |
4.74 |
4.63 - 4.81 |
1.1055 times |
Fri 22 August 2025 |
4.76 (8.68%) |
4.35 |
4.32 - 4.79 |
1.3513 times |
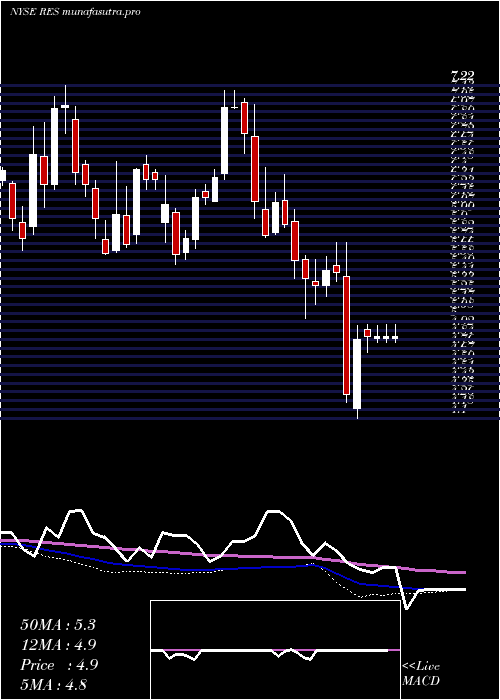
Monthly price and charts RpcInc Strong monthly Stock price targets for RpcInc RES are 3.98 and 4.68 | Monthly Target 1 | 3.81 | | Monthly Target 2 | 4.15 | | Monthly Target 3 | 4.5133333333333 | | Monthly Target 4 | 4.85 | | Monthly Target 5 | 5.21 |
Monthly price and volumes Rpc Inc
| Date |
Closing |
Open |
Range |
Volume |
Mon 20 October 2025 |
4.48 (-5.88%) |
4.70 |
4.18 - 4.88 |
0.4323 times |
Tue 30 September 2025 |
4.76 (-0.21%) |
4.75 |
4.41 - 4.96 |
0.9496 times |
Fri 29 August 2025 |
4.77 (2.58%) |
4.60 |
4.32 - 4.81 |
1.0935 times |
Thu 31 July 2025 |
4.65 (-1.69%) |
4.72 |
4.39 - 5.47 |
1.4476 times |
Mon 30 June 2025 |
4.73 (6.53%) |
4.55 |
4.40 - 5.30 |
1.0246 times |
Fri 30 May 2025 |
4.44 (-6.13%) |
4.72 |
4.39 - 5.14 |
0.705 times |
Wed 30 April 2025 |
4.73 (-14%) |
5.47 |
4.10 - 5.75 |
1.2086 times |
Mon 31 March 2025 |
5.50 (-1.43%) |
5.59 |
5.03 - 5.75 |
1.2002 times |
Fri 28 February 2025 |
5.58 (-8.97%) |
6.05 |
5.41 - 6.45 |
0.7981 times |
Fri 31 January 2025 |
6.13 (3.2%) |
6.07 |
5.97 - 7.17 |
1.1405 times |
Tue 31 December 2024 |
5.94 (-6.31%) |
5.93 |
5.54 - 6.37 |
0.8603 times |

DMA SMA EMA moving averages of Rpc Inc RES
DMA (daily moving average) of Rpc Inc RES
| DMA period | DMA value | | 5 day DMA | 4.36 | | 12 day DMA | 4.56 | | 20 day DMA | 4.61 | | 35 day DMA | 4.63 | | 50 day DMA | 4.6 | | 100 day DMA | 4.71 | | 150 day DMA | 4.8 | | 200 day DMA | 5.13 | EMA (exponential moving average) of Rpc Inc RES
| EMA period | EMA current | EMA prev | EMA prev2 | | 5 day EMA | 4.42 | 4.39 | 4.41 | | 12 day EMA | 4.51 | 4.51 | 4.54 | | 20 day EMA | 4.55 | 4.56 | 4.58 | | 35 day EMA | 4.58 | 4.59 | 4.6 | | 50 day EMA | 4.59 | 4.59 | 4.6 |
SMA (simple moving average) of Rpc Inc RES
| SMA period | SMA current | SMA prev | SMA prev2 | | 5 day SMA | 4.36 | 4.33 | 4.41 | | 12 day SMA | 4.56 | 4.59 | 4.63 | | 20 day SMA | 4.61 | 4.62 | 4.63 | | 35 day SMA | 4.63 | 4.64 | 4.65 | | 50 day SMA | 4.6 | 4.6 | 4.61 | | 100 day SMA | 4.71 | 4.71 | 4.71 | | 150 day SMA | 4.8 | 4.81 | 4.82 | | 200 day SMA | 5.13 | 5.14 | 5.15 |
|
|
