PimcoStrategic RCS full analysis,charts,indicators,moving averages,SMA,DMA,EMA,ADX,MACD,RSIPimco Strategic RCS WideScreen charts, DMA,SMA,EMA technical analysis, forecast prediction, by indicators ADX,MACD,RSI,CCI NYSE stock exchange
operates under N A sector & deals in N A
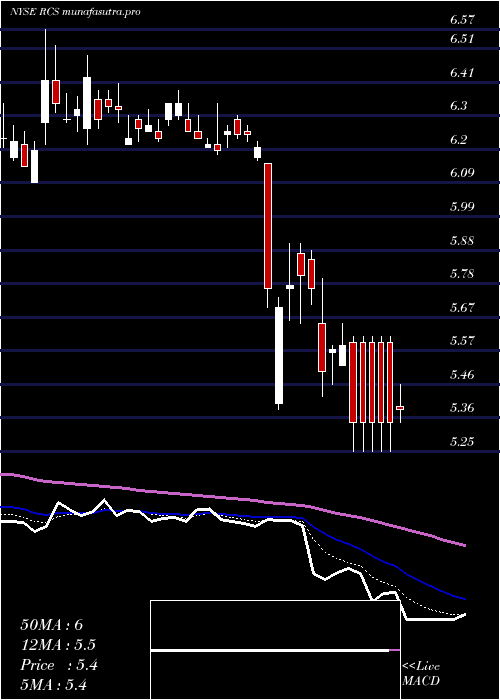
Daily price and charts and targets PimcoStrategic Strong Daily Stock price targets for PimcoStrategic RCS are 7.01 and 7.19 | Daily Target 1 | 6.89 | | Daily Target 2 | 6.95 | | Daily Target 3 | 7.0666666666667 | | Daily Target 4 | 7.13 | | Daily Target 5 | 7.25 |
Daily price and volume Pimco Strategic
| Date |
Closing |
Open |
Range |
Volume |
Tue 21 October 2025 |
7.02 (-1.27%) |
7.00 |
7.00 - 7.18 |
1.1471 times |
Mon 20 October 2025 |
7.11 (-2.6%) |
7.30 |
7.05 - 7.41 |
1.7832 times |
Fri 17 October 2025 |
7.30 (0.55%) |
7.23 |
7.14 - 7.36 |
0.8844 times |
Thu 16 October 2025 |
7.26 (-1.09%) |
7.34 |
7.22 - 7.49 |
0.8869 times |
Wed 15 October 2025 |
7.34 (-1.74%) |
7.48 |
7.28 - 7.54 |
1.134 times |
Tue 14 October 2025 |
7.47 (-1.19%) |
7.50 |
7.36 - 7.55 |
0.6424 times |
Mon 13 October 2025 |
7.56 (0%) |
7.57 |
7.55 - 7.78 |
0.6793 times |
Fri 10 October 2025 |
7.56 (-1.43%) |
7.67 |
7.53 - 7.76 |
1.0414 times |
Thu 09 October 2025 |
7.67 (-0.9%) |
7.75 |
7.65 - 7.75 |
0.6961 times |
Wed 08 October 2025 |
7.74 (-1.28%) |
7.90 |
7.71 - 7.90 |
1.1052 times |
Tue 07 October 2025 |
7.84 (-1.26%) |
7.92 |
7.82 - 7.94 |
1.5568 times |
Weekly price and charts PimcoStrategic Strong weekly Stock price targets for PimcoStrategic RCS are 6.81 and 7.22 | Weekly Target 1 | 6.73 | | Weekly Target 2 | 6.88 | | Weekly Target 3 | 7.1433333333333 | | Weekly Target 4 | 7.29 | | Weekly Target 5 | 7.55 |
Weekly price and volumes for Pimco Strategic
| Date |
Closing |
Open |
Range |
Volume |
Tue 21 October 2025 |
7.02 (-3.84%) |
7.30 |
7.00 - 7.41 |
0.7541 times |
Fri 17 October 2025 |
7.30 (-3.44%) |
7.57 |
7.14 - 7.78 |
1.0878 times |
Fri 10 October 2025 |
7.56 (-2.45%) |
7.75 |
7.53 - 7.94 |
1.8889 times |
Fri 03 October 2025 |
7.75 (3.2%) |
7.55 |
7.50 - 8.00 |
1.8231 times |
Fri 26 September 2025 |
7.51 (0.27%) |
7.49 |
7.49 - 7.59 |
0.8021 times |
Fri 19 September 2025 |
7.49 (2.32%) |
7.32 |
7.32 - 7.51 |
1.1586 times |
Fri 12 September 2025 |
7.32 (0.97%) |
7.28 |
7.26 - 7.35 |
0.8207 times |
Fri 05 September 2025 |
7.25 (0.28%) |
7.21 |
7.18 - 7.25 |
0.7047 times |
Fri 29 August 2025 |
7.23 (0%) |
7.22 |
7.16 - 7.24 |
0.1611 times |
Fri 29 August 2025 |
7.23 (1.26%) |
7.18 |
7.14 - 7.24 |
0.799 times |
Fri 22 August 2025 |
7.14 (-0.14%) |
7.15 |
7.07 - 7.17 |
0.8544 times |
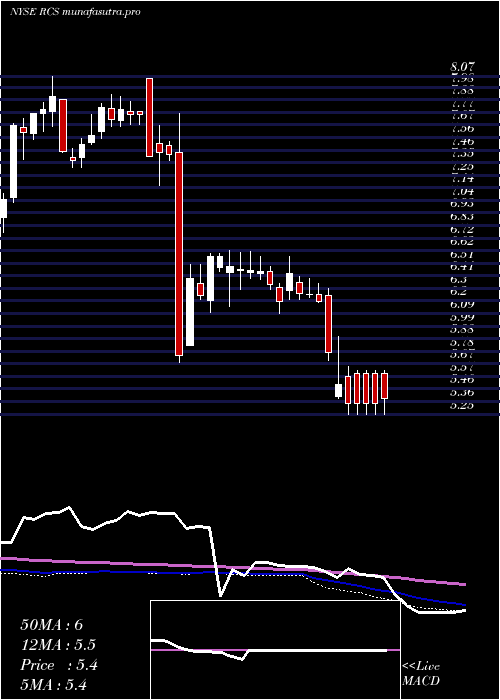
Monthly price and charts PimcoStrategic Strong monthly Stock price targets for PimcoStrategic RCS are 6.51 and 7.51 | Monthly Target 1 | 6.34 | | Monthly Target 2 | 6.68 | | Monthly Target 3 | 7.34 | | Monthly Target 4 | 7.68 | | Monthly Target 5 | 8.34 |
Monthly price and volumes Pimco Strategic
| Date |
Closing |
Open |
Range |
Volume |
Tue 21 October 2025 |
7.02 (-7.51%) |
7.64 |
7.00 - 8.00 |
1.0396 times |
Tue 30 September 2025 |
7.59 (4.98%) |
7.21 |
7.18 - 7.62 |
0.7738 times |
Fri 29 August 2025 |
7.23 (2.12%) |
7.08 |
7.05 - 7.24 |
0.7592 times |
Thu 31 July 2025 |
7.08 (1.72%) |
7.00 |
6.95 - 7.16 |
0.6562 times |
Mon 30 June 2025 |
6.96 (8.41%) |
6.45 |
6.41 - 7.04 |
0.6833 times |
Fri 30 May 2025 |
6.42 (13.03%) |
5.74 |
5.65 - 6.44 |
0.7384 times |
Wed 30 April 2025 |
5.68 (-9.12%) |
6.29 |
5.25 - 6.30 |
1.041 times |
Mon 31 March 2025 |
6.25 (0.97%) |
6.28 |
6.18 - 6.57 |
0.728 times |
Fri 28 February 2025 |
6.19 (-4.18%) |
6.43 |
6.09 - 6.61 |
1.138 times |
Fri 31 January 2025 |
6.46 (-15.22%) |
7.70 |
5.68 - 7.76 |
2.4425 times |
Tue 31 December 2024 |
7.62 (-1.68%) |
8.05 |
7.16 - 8.05 |
0.9375 times |

DMA SMA EMA moving averages of Pimco Strategic RCS
DMA (daily moving average) of Pimco Strategic RCS
| DMA period | DMA value | | 5 day DMA | 7.21 | | 12 day DMA | 7.48 | | 20 day DMA | 7.55 | | 35 day DMA | 7.48 | | 50 day DMA | 7.39 | | 100 day DMA | 7.17 | | 150 day DMA | 6.75 | | 200 day DMA | 6.65 | EMA (exponential moving average) of Pimco Strategic RCS
| EMA period | EMA current | EMA prev | EMA prev2 | | 5 day EMA | 7.21 | 7.3 | 7.39 | | 12 day EMA | 7.38 | 7.44 | 7.5 | | 20 day EMA | 7.45 | 7.49 | 7.53 | | 35 day EMA | 7.42 | 7.44 | 7.46 | | 50 day EMA | 7.36 | 7.37 | 7.38 |
SMA (simple moving average) of Pimco Strategic RCS
| SMA period | SMA current | SMA prev | SMA prev2 | | 5 day SMA | 7.21 | 7.3 | 7.39 | | 12 day SMA | 7.48 | 7.55 | 7.61 | | 20 day SMA | 7.55 | 7.58 | 7.6 | | 35 day SMA | 7.48 | 7.48 | 7.49 | | 50 day SMA | 7.39 | 7.39 | 7.39 | | 100 day SMA | 7.17 | 7.16 | 7.15 | | 150 day SMA | 6.75 | 6.74 | 6.74 | | 200 day SMA | 6.65 | 6.65 | 6.64 |
|
|
