RestaurantBrands QSR full analysis,charts,indicators,moving averages,SMA,DMA,EMA,ADX,MACD,RSIRestaurant Brands QSR WideScreen charts, DMA,SMA,EMA technical analysis, forecast prediction, by indicators ADX,MACD,RSI,CCI NYSE stock exchange
operates under Consumer Services sector & deals in Restaurants
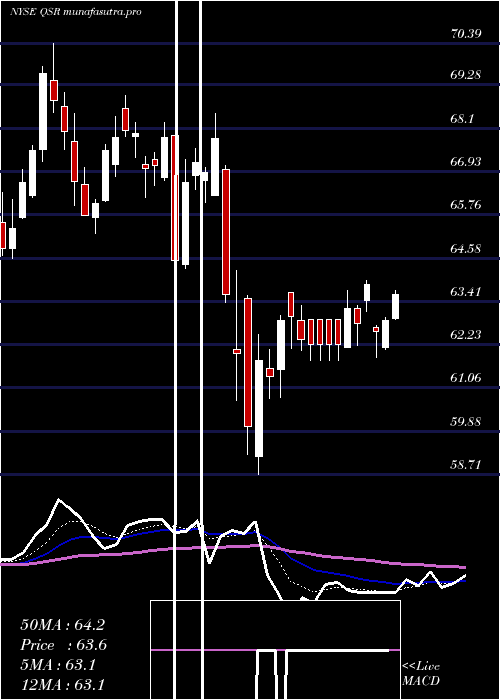
Daily price and charts and targets RestaurantBrands Strong Daily Stock price targets for RestaurantBrands QSR are 71.54 and 72.27 | Daily Target 1 | 71.4 | | Daily Target 2 | 71.67 | | Daily Target 3 | 72.133333333333 | | Daily Target 4 | 72.4 | | Daily Target 5 | 72.86 |
Daily price and volume Restaurant Brands
| Date |
Closing |
Open |
Range |
Volume |
Thu 04 December 2025 |
71.93 (-0.03%) |
72.12 |
71.87 - 72.60 |
1.0121 times |
Wed 03 December 2025 |
71.95 (0.95%) |
71.50 |
71.38 - 72.10 |
1.0052 times |
Tue 02 December 2025 |
71.27 (-0.47%) |
72.00 |
71.01 - 72.25 |
0.563 times |
Mon 01 December 2025 |
71.61 (-1.08%) |
72.30 |
71.52 - 72.36 |
0.6173 times |
Fri 28 November 2025 |
72.39 (0.24%) |
72.28 |
71.96 - 73.13 |
0.4047 times |
Wed 26 November 2025 |
72.22 (0.26%) |
72.08 |
72.01 - 72.98 |
1.2524 times |
Tue 25 November 2025 |
72.03 (2.99%) |
70.13 |
70.13 - 72.36 |
1.3086 times |
Mon 24 November 2025 |
69.94 (-0.81%) |
70.55 |
69.82 - 70.74 |
1.2471 times |
Fri 21 November 2025 |
70.51 (3.71%) |
68.45 |
68.09 - 70.98 |
1.8052 times |
Thu 20 November 2025 |
67.99 (0.24%) |
67.89 |
67.84 - 68.85 |
0.7844 times |
Wed 19 November 2025 |
67.83 (0.65%) |
67.55 |
67.08 - 68.16 |
0.7825 times |
Weekly price and charts RestaurantBrands Strong weekly Stock price targets for RestaurantBrands QSR are 70.68 and 72.27 | Weekly Target 1 | 70.26 | | Weekly Target 2 | 71.09 | | Weekly Target 3 | 71.846666666667 | | Weekly Target 4 | 72.68 | | Weekly Target 5 | 73.44 |
Weekly price and volumes for Restaurant Brands
| Date |
Closing |
Open |
Range |
Volume |
Thu 04 December 2025 |
71.93 (-0.64%) |
72.30 |
71.01 - 72.60 |
0.7571 times |
Fri 28 November 2025 |
72.39 (2.67%) |
70.55 |
69.82 - 73.13 |
0.9974 times |
Fri 21 November 2025 |
70.51 (2.66%) |
68.43 |
67.08 - 70.98 |
1.4163 times |
Fri 14 November 2025 |
68.68 (1.39%) |
68.22 |
67.43 - 70.46 |
1.5328 times |
Fri 07 November 2025 |
67.74 (3.12%) |
65.60 |
65.28 - 68.55 |
1.2664 times |
Fri 31 October 2025 |
65.69 (0%) |
66.81 |
65.50 - 66.98 |
0.3167 times |
Fri 31 October 2025 |
65.69 (-2.57%) |
67.56 |
65.28 - 68.27 |
1.4141 times |
Fri 24 October 2025 |
67.42 (0.06%) |
67.32 |
67.07 - 68.35 |
0.7262 times |
Fri 17 October 2025 |
67.38 (0.18%) |
66.44 |
66.35 - 69.50 |
1.1413 times |
Tue 07 October 2025 |
67.26 (-1.67%) |
68.35 |
67.20 - 69.26 |
0.4318 times |
Fri 03 October 2025 |
68.40 (5.38%) |
64.99 |
64.11 - 68.59 |
1.2114 times |
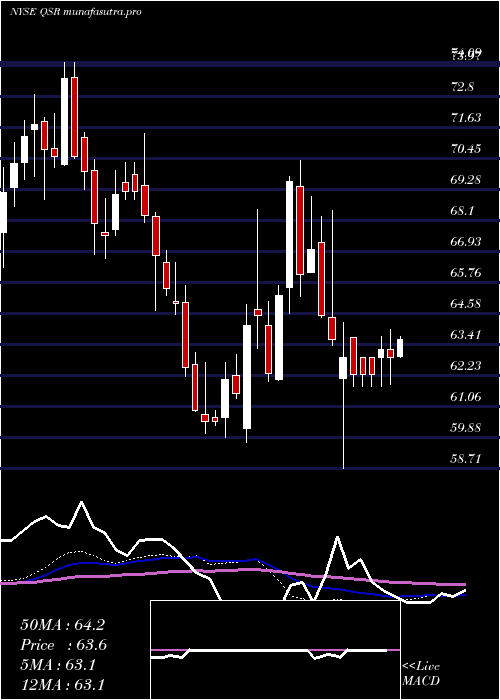
Monthly price and charts RestaurantBrands Strong monthly Stock price targets for RestaurantBrands QSR are 70.68 and 72.27 | Monthly Target 1 | 70.26 | | Monthly Target 2 | 71.09 | | Monthly Target 3 | 71.846666666667 | | Monthly Target 4 | 72.68 | | Monthly Target 5 | 73.44 |
Monthly price and volumes Restaurant Brands
| Date |
Closing |
Open |
Range |
Volume |
Thu 04 December 2025 |
71.93 (-0.64%) |
72.30 |
71.01 - 72.60 |
0.155 times |
Fri 28 November 2025 |
72.39 (10.2%) |
65.60 |
65.28 - 73.13 |
1.0672 times |
Fri 31 October 2025 |
65.69 (2.42%) |
64.22 |
64.17 - 69.50 |
0.9559 times |
Tue 30 September 2025 |
64.14 (1.28%) |
63.02 |
61.33 - 65.94 |
1.4089 times |
Fri 29 August 2025 |
63.33 (-6.68%) |
68.51 |
62.34 - 69.32 |
1.0745 times |
Thu 31 July 2025 |
67.86 (2.37%) |
66.38 |
66.38 - 71.77 |
0.8761 times |
Mon 30 June 2025 |
66.29 (-7.17%) |
70.94 |
64.44 - 72.32 |
1.6266 times |
Fri 30 May 2025 |
71.41 (10.89%) |
64.08 |
63.69 - 72.32 |
1.0893 times |
Wed 30 April 2025 |
64.40 (-3.36%) |
66.82 |
58.71 - 68.49 |
0.912 times |
Mon 31 March 2025 |
66.64 (2.13%) |
65.55 |
64.30 - 70.39 |
0.8345 times |
Fri 28 February 2025 |
65.25 (6.03%) |
60.22 |
59.67 - 68.54 |
0.9683 times |

DMA SMA EMA moving averages of Restaurant Brands QSR
DMA (daily moving average) of Restaurant Brands QSR
| DMA period | DMA value | | 5 day DMA | 71.83 | | 12 day DMA | 70.59 | | 20 day DMA | 69.87 | | 35 day DMA | 68.62 | | 50 day DMA | 67.95 | | 100 day DMA | 66.73 | | 150 day DMA | 67.23 | | 200 day DMA | 66.64 | EMA (exponential moving average) of Restaurant Brands QSR
| EMA period | EMA current | EMA prev | EMA prev2 | | 5 day EMA | 71.69 | 71.57 | 71.38 | | 12 day EMA | 70.89 | 70.7 | 70.47 | | 20 day EMA | 70.08 | 69.88 | 69.66 | | 35 day EMA | 69.01 | 68.84 | 68.66 | | 50 day EMA | 67.99 | 67.83 | 67.66 |
SMA (simple moving average) of Restaurant Brands QSR
| SMA period | SMA current | SMA prev | SMA prev2 | | 5 day SMA | 71.83 | 71.89 | 71.9 | | 12 day SMA | 70.59 | 70.27 | 69.99 | | 20 day SMA | 69.87 | 69.62 | 69.34 | | 35 day SMA | 68.62 | 68.54 | 68.45 | | 50 day SMA | 67.95 | 67.78 | 67.6 | | 100 day SMA | 66.73 | 66.69 | 66.64 | | 150 day SMA | 67.23 | 67.17 | 67.11 | | 200 day SMA | 66.64 | 66.61 | 66.58 |
|
|
