QiagenN QGEN full analysis,charts,indicators,moving averages,SMA,DMA,EMA,ADX,MACD,RSIQiagen N QGEN WideScreen charts, DMA,SMA,EMA technical analysis, forecast prediction, by indicators ADX,MACD,RSI,CCI NYSE stock exchange
operates under Health Care sector & deals in Biotechnology Biological Products No Diagnostic Substances
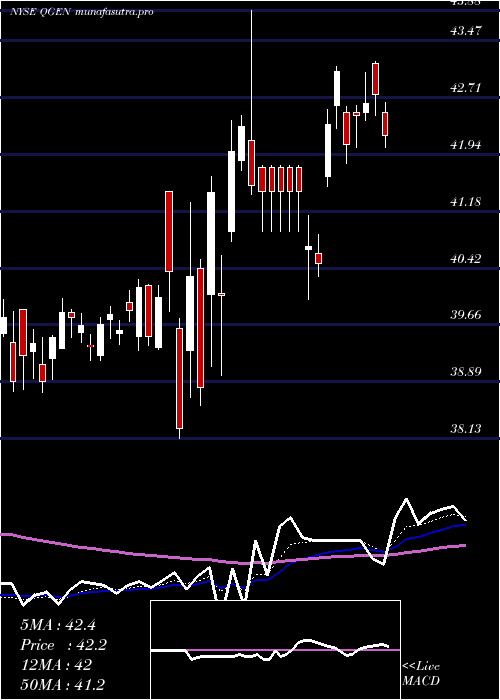
Daily price and charts and targets QiagenN Strong Daily Stock price targets for QiagenN QGEN are 48.41 and 49.25 | Daily Target 1 | 47.76 | | Daily Target 2 | 48.22 | | Daily Target 3 | 48.603333333333 | | Daily Target 4 | 49.06 | | Daily Target 5 | 49.44 |
Daily price and volume Qiagen N
| Date |
Closing |
Open |
Range |
Volume |
Mon 20 October 2025 |
48.67 (0.83%) |
48.21 |
48.15 - 48.99 |
0.8386 times |
Fri 17 October 2025 |
48.27 (0.29%) |
48.06 |
47.97 - 48.46 |
0.7028 times |
Thu 16 October 2025 |
48.13 (1.3%) |
47.52 |
47.52 - 48.44 |
1.6503 times |
Wed 15 October 2025 |
47.51 (0.02%) |
47.42 |
47.07 - 47.71 |
0.7131 times |
Tue 14 October 2025 |
47.50 (0.59%) |
47.06 |
46.94 - 47.57 |
0.6512 times |
Mon 13 October 2025 |
47.22 (0.79%) |
46.86 |
46.73 - 47.51 |
0.7359 times |
Fri 10 October 2025 |
46.85 (-0.17%) |
47.37 |
46.45 - 47.59 |
1.3076 times |
Thu 09 October 2025 |
46.93 (-1.74%) |
47.74 |
46.92 - 47.93 |
1.1913 times |
Wed 08 October 2025 |
47.76 (2.05%) |
46.83 |
46.80 - 47.80 |
1.1758 times |
Tue 07 October 2025 |
46.80 (-0.34%) |
46.87 |
46.76 - 47.16 |
1.0334 times |
Mon 06 October 2025 |
46.96 (0.34%) |
46.58 |
46.58 - 47.09 |
0.6198 times |
Weekly price and charts QiagenN Strong weekly Stock price targets for QiagenN QGEN are 48.41 and 49.25 | Weekly Target 1 | 47.76 | | Weekly Target 2 | 48.22 | | Weekly Target 3 | 48.603333333333 | | Weekly Target 4 | 49.06 | | Weekly Target 5 | 49.44 |
Weekly price and volumes for Qiagen N
| Date |
Closing |
Open |
Range |
Volume |
Mon 20 October 2025 |
48.67 (0.83%) |
48.21 |
48.15 - 48.99 |
0.1642 times |
Fri 17 October 2025 |
48.27 (3.03%) |
46.86 |
46.73 - 48.46 |
0.8722 times |
Fri 10 October 2025 |
46.85 (0.11%) |
46.58 |
46.45 - 47.93 |
1.0434 times |
Fri 03 October 2025 |
46.80 (6.61%) |
43.92 |
43.74 - 46.89 |
0.9767 times |
Fri 26 September 2025 |
43.90 (-4.44%) |
46.10 |
43.80 - 46.23 |
1.085 times |
Fri 19 September 2025 |
45.94 (1.46%) |
45.37 |
45.12 - 46.18 |
1.3467 times |
Fri 12 September 2025 |
45.28 (-4.77%) |
47.34 |
45.28 - 47.93 |
0.9764 times |
Fri 05 September 2025 |
47.55 (2.26%) |
47.35 |
46.27 - 47.71 |
1.1997 times |
Fri 29 August 2025 |
46.50 (0%) |
46.11 |
46.08 - 46.63 |
0.3837 times |
Fri 29 August 2025 |
46.50 (-6.51%) |
49.89 |
45.81 - 49.93 |
1.9519 times |
Fri 22 August 2025 |
49.74 (0.79%) |
49.31 |
48.62 - 49.96 |
1.044 times |
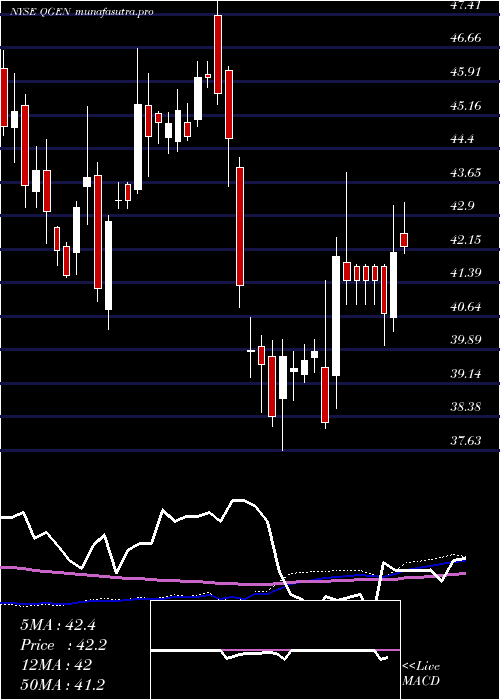
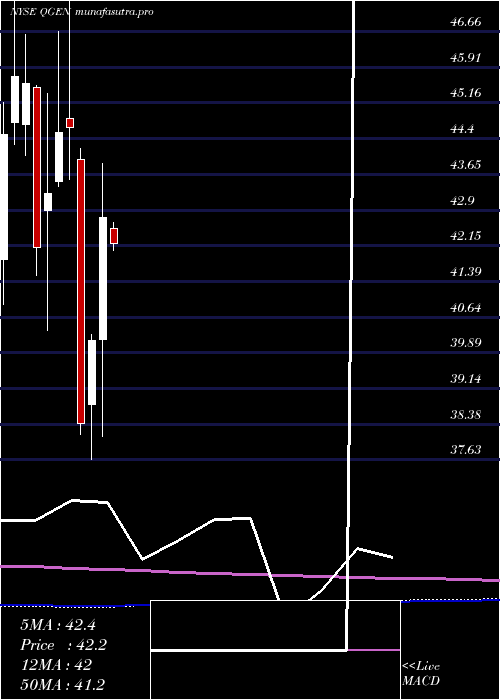
Monthly price and charts QiagenN Strong monthly Stock price targets for QiagenN QGEN are 46.76 and 50.9 | Monthly Target 1 | 43.36 | | Monthly Target 2 | 46.02 | | Monthly Target 3 | 47.503333333333 | | Monthly Target 4 | 50.16 | | Monthly Target 5 | 51.64 |
Monthly price and volumes Qiagen N
| Date |
Closing |
Open |
Range |
Volume |
Mon 20 October 2025 |
48.67 (8.93%) |
44.86 |
44.85 - 48.99 |
0.5133 times |
Tue 30 September 2025 |
44.68 (-3.91%) |
47.35 |
43.74 - 47.93 |
0.9663 times |
Fri 29 August 2025 |
46.50 (-5.76%) |
49.79 |
45.81 - 50.23 |
1.2154 times |
Thu 31 July 2025 |
49.34 (2.66%) |
47.88 |
47.25 - 51.88 |
1.2194 times |
Mon 30 June 2025 |
48.06 (6.49%) |
45.07 |
44.71 - 48.36 |
0.9832 times |
Fri 30 May 2025 |
45.13 (5.57%) |
42.50 |
41.11 - 45.41 |
1.2036 times |
Wed 30 April 2025 |
42.75 (6.48%) |
40.18 |
38.13 - 43.88 |
1.165 times |
Mon 31 March 2025 |
40.15 (4.56%) |
38.79 |
37.63 - 40.27 |
0.8029 times |
Fri 28 February 2025 |
38.40 (-13.98%) |
43.97 |
38.16 - 44.20 |
0.9828 times |
Fri 31 January 2025 |
44.64 (0.25%) |
44.82 |
43.55 - 47.93 |
0.9481 times |
Tue 31 December 2024 |
44.53 (2.98%) |
43.49 |
43.39 - 46.66 |
0.485 times |
DMA SMA EMA moving averages of Qiagen N QGEN
DMA (daily moving average) of Qiagen N QGEN
| DMA period | DMA value | | 5 day DMA | 48.02 | | 12 day DMA | 47.45 | | 20 day DMA | 46.45 | | 35 day DMA | 46.37 | | 50 day DMA | 47.01 | | 100 day DMA | 47.41 | | 150 day DMA | 45.41 | | 200 day DMA | 44.59 | EMA (exponential moving average) of Qiagen N QGEN
| EMA period | EMA current | EMA prev | EMA prev2 | | 5 day EMA | 48.09 | 47.8 | 47.56 | | 12 day EMA | 47.43 | 47.21 | 47.02 | | 20 day EMA | 47.06 | 46.89 | 46.75 | | 35 day EMA | 47.06 | 46.97 | 46.89 | | 50 day EMA | 47.23 | 47.17 | 47.12 |
SMA (simple moving average) of Qiagen N QGEN
| SMA period | SMA current | SMA prev | SMA prev2 | | 5 day SMA | 48.02 | 47.73 | 47.44 | | 12 day SMA | 47.45 | 47.25 | 47.09 | | 20 day SMA | 46.45 | 46.31 | 46.19 | | 35 day SMA | 46.37 | 46.31 | 46.26 | | 50 day SMA | 47.01 | 46.99 | 46.99 | | 100 day SMA | 47.41 | 47.36 | 47.3 | | 150 day SMA | 45.41 | 45.35 | 45.29 | | 200 day SMA | 44.59 | 44.57 | 44.55 |
|
|
