QudianInc QD full analysis,charts,indicators,moving averages,SMA,DMA,EMA,ADX,MACD,RSIQudian Inc QD WideScreen charts, DMA,SMA,EMA technical analysis, forecast prediction, by indicators ADX,MACD,RSI,CCI NYSE stock exchange
operates under Finance sector & deals in Finance Consumer Services
Daily price and charts and targets QudianInc Strong Daily Stock price targets for QudianInc QD are 4.85 and 4.91 | Daily Target 1 | 4.8 | | Daily Target 2 | 4.84 | | Daily Target 3 | 4.8633333333333 | | Daily Target 4 | 4.9 | | Daily Target 5 | 4.92 |
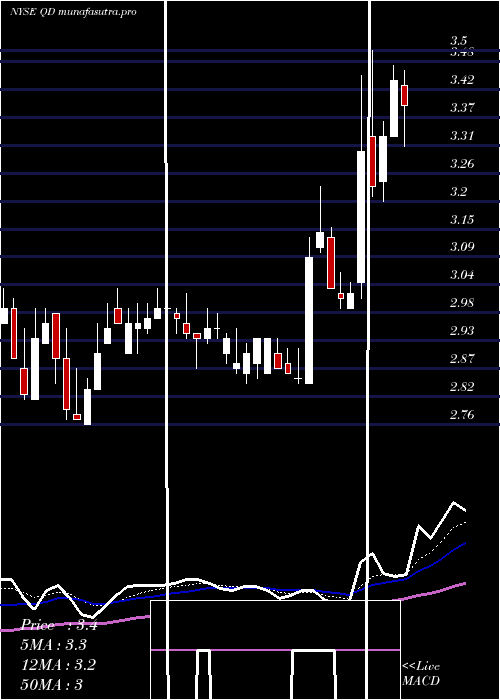
Daily price and volume Qudian Inc
| Date |
Closing |
Open |
Range |
Volume |
Thu 04 December 2025 |
4.87 (0.62%) |
4.83 |
4.83 - 4.89 |
0.6667 times |
Wed 03 December 2025 |
4.84 (1.26%) |
4.77 |
4.77 - 4.85 |
0.3716 times |
Tue 02 December 2025 |
4.78 (0.63%) |
4.77 |
4.69 - 4.81 |
0.6387 times |
Mon 01 December 2025 |
4.75 (-1.66%) |
4.77 |
4.66 - 4.84 |
0.7131 times |
Fri 28 November 2025 |
4.83 (-1.02%) |
4.86 |
4.83 - 4.89 |
0.6494 times |
Wed 26 November 2025 |
4.88 (0%) |
4.85 |
4.79 - 4.91 |
1.0173 times |
Tue 25 November 2025 |
4.88 (1.24%) |
4.86 |
4.76 - 4.91 |
1.4747 times |
Mon 24 November 2025 |
4.82 (10.3%) |
4.40 |
4.40 - 4.88 |
2.0737 times |
Fri 21 November 2025 |
4.37 (-4.17%) |
4.55 |
4.28 - 4.60 |
1.4026 times |
Thu 20 November 2025 |
4.56 (-2.98%) |
4.79 |
4.55 - 4.81 |
0.9923 times |
Wed 19 November 2025 |
4.70 (-4.28%) |
4.81 |
4.61 - 4.87 |
1.173 times |
Weekly price and charts QudianInc Strong weekly Stock price targets for QudianInc QD are 4.77 and 5 | Weekly Target 1 | 4.58 | | Weekly Target 2 | 4.72 | | Weekly Target 3 | 4.8066666666667 | | Weekly Target 4 | 4.95 | | Weekly Target 5 | 5.04 |
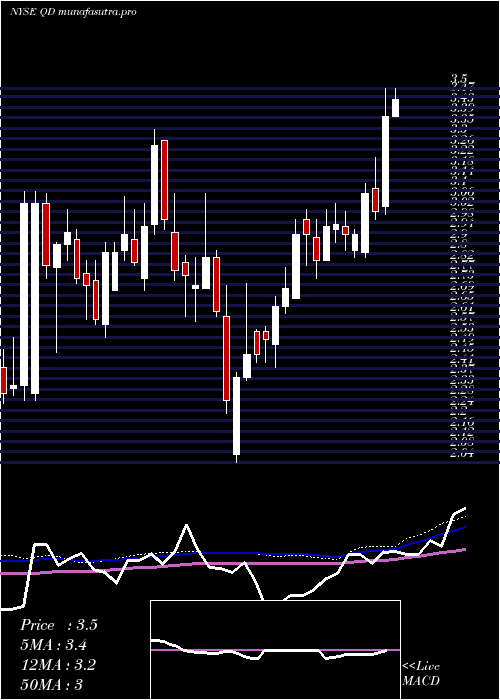
Weekly price and volumes for Qudian Inc
| Date |
Closing |
Open |
Range |
Volume |
Thu 04 December 2025 |
4.87 (0.83%) |
4.77 |
4.66 - 4.89 |
0.5535 times |
Fri 28 November 2025 |
4.83 (10.53%) |
4.40 |
4.40 - 4.91 |
1.2078 times |
Fri 21 November 2025 |
4.37 (-11%) |
4.84 |
4.28 - 4.95 |
1.3162 times |
Fri 14 November 2025 |
4.91 (3.37%) |
4.81 |
4.64 - 4.95 |
0.9155 times |
Fri 07 November 2025 |
4.75 (-0.63%) |
4.89 |
4.62 - 5.05 |
1.1379 times |
Fri 31 October 2025 |
4.78 (0%) |
4.51 |
4.51 - 4.83 |
0.1822 times |
Fri 31 October 2025 |
4.78 (7.66%) |
4.47 |
4.47 - 4.94 |
1.4332 times |
Fri 24 October 2025 |
4.44 (1.6%) |
4.37 |
4.29 - 4.51 |
1.1854 times |
Fri 17 October 2025 |
4.37 (-5.21%) |
4.25 |
4.25 - 4.70 |
1.2867 times |
Tue 07 October 2025 |
4.61 (3.6%) |
4.30 |
4.28 - 4.77 |
0.7815 times |
Fri 03 October 2025 |
4.45 (-0.45%) |
4.47 |
4.24 - 4.65 |
1.4573 times |
Monthly price and charts QudianInc Strong monthly Stock price targets for QudianInc QD are 4.77 and 5 | Monthly Target 1 | 4.58 | | Monthly Target 2 | 4.72 | | Monthly Target 3 | 4.8066666666667 | | Monthly Target 4 | 4.95 | | Monthly Target 5 | 5.04 |
Monthly price and volumes Qudian Inc
| Date |
Closing |
Open |
Range |
Volume |
Thu 04 December 2025 |
4.87 (0.83%) |
4.77 |
4.66 - 4.89 |
0.081 times |
Fri 28 November 2025 |
4.83 (1.05%) |
4.89 |
4.28 - 5.05 |
0.6695 times |
Fri 31 October 2025 |
4.78 (11.94%) |
4.28 |
4.25 - 4.94 |
0.8246 times |
Tue 30 September 2025 |
4.27 (-6.36%) |
4.50 |
3.80 - 4.75 |
0.9276 times |
Fri 29 August 2025 |
4.56 (12.87%) |
3.95 |
3.83 - 5.08 |
1.6292 times |
Thu 31 July 2025 |
4.04 (28.66%) |
3.13 |
2.99 - 4.07 |
1.2296 times |
Mon 30 June 2025 |
3.14 (6.08%) |
2.95 |
2.84 - 3.23 |
1.2885 times |
Fri 30 May 2025 |
2.96 (8.82%) |
2.71 |
2.62 - 3.03 |
1.013 times |
Wed 30 April 2025 |
2.72 (1.12%) |
2.69 |
2.04 - 2.80 |
1.2729 times |
Mon 31 March 2025 |
2.69 (-3.58%) |
2.82 |
2.59 - 3.09 |
1.064 times |
Fri 28 February 2025 |
2.79 (-1.06%) |
2.76 |
2.71 - 3.34 |
1.0595 times |
DMA SMA EMA moving averages of Qudian Inc QD
DMA (daily moving average) of Qudian Inc QD
| DMA period | DMA value | | 5 day DMA | 4.81 | | 12 day DMA | 4.77 | | 20 day DMA | 4.77 | | 35 day DMA | 4.7 | | 50 day DMA | 4.61 | | 100 day DMA | 4.35 | | 150 day DMA | 3.88 | | 200 day DMA | 3.58 | EMA (exponential moving average) of Qudian Inc QD
| EMA period | EMA current | EMA prev | EMA prev2 | | 5 day EMA | 4.82 | 4.8 | 4.78 | | 12 day EMA | 4.79 | 4.78 | 4.77 | | 20 day EMA | 4.75 | 4.74 | 4.73 | | 35 day EMA | 4.68 | 4.67 | 4.66 | | 50 day EMA | 4.59 | 4.58 | 4.57 |
SMA (simple moving average) of Qudian Inc QD
| SMA period | SMA current | SMA prev | SMA prev2 | | 5 day SMA | 4.81 | 4.82 | 4.82 | | 12 day SMA | 4.77 | 4.76 | 4.76 | | 20 day SMA | 4.77 | 4.78 | 4.78 | | 35 day SMA | 4.7 | 4.69 | 4.68 | | 50 day SMA | 4.61 | 4.59 | 4.57 | | 100 day SMA | 4.35 | 4.34 | 4.32 | | 150 day SMA | 3.88 | 3.87 | 3.85 | | 200 day SMA | 3.58 | 3.57 | 3.57 |
|
|
