PimcoCorporate PTY full analysis,charts,indicators,moving averages,SMA,DMA,EMA,ADX,MACD,RSIPimco Corporate PTY WideScreen charts, DMA,SMA,EMA technical analysis, forecast prediction, by indicators ADX,MACD,RSI,CCI NYSE stock exchange
operates under N A sector & deals in N A
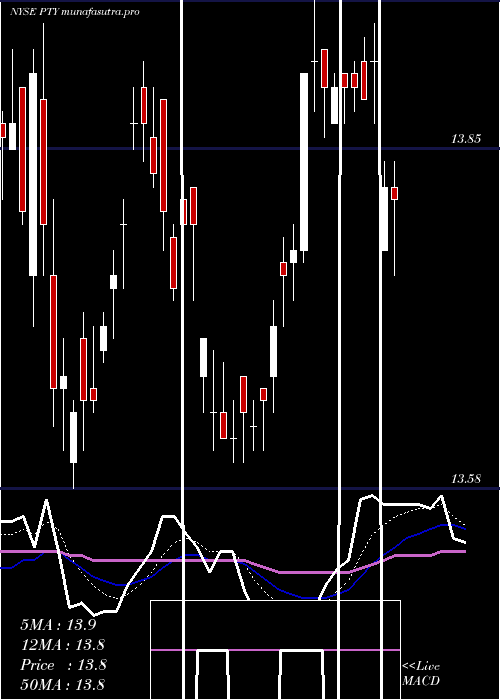
Daily price and charts and targets PimcoCorporate Strong Daily Stock price targets for PimcoCorporate PTY are 13.17 and 13.23 | Daily Target 1 | 13.15 | | Daily Target 2 | 13.18 | | Daily Target 3 | 13.213333333333 | | Daily Target 4 | 13.24 | | Daily Target 5 | 13.27 |
Daily price and volume Pimco Corporate
| Date |
Closing |
Open |
Range |
Volume |
Thu 04 December 2025 |
13.20 (-0.08%) |
13.21 |
13.19 - 13.25 |
0.6225 times |
Wed 03 December 2025 |
13.21 (0.15%) |
13.16 |
13.13 - 13.24 |
0.9617 times |
Tue 02 December 2025 |
13.19 (-0.75%) |
13.30 |
13.18 - 13.31 |
1.1302 times |
Mon 01 December 2025 |
13.29 (-0.08%) |
13.26 |
13.21 - 13.32 |
1.2684 times |
Fri 28 November 2025 |
13.30 (0.23%) |
13.27 |
13.24 - 13.30 |
0.498 times |
Wed 26 November 2025 |
13.27 (-0.08%) |
13.29 |
13.23 - 13.31 |
0.6329 times |
Tue 25 November 2025 |
13.28 (0.53%) |
13.24 |
13.23 - 13.30 |
0.942 times |
Mon 24 November 2025 |
13.21 (0.76%) |
13.20 |
13.16 - 13.23 |
0.9872 times |
Fri 21 November 2025 |
13.11 (1.16%) |
12.96 |
12.96 - 13.11 |
1.1047 times |
Thu 20 November 2025 |
12.96 (1.09%) |
12.83 |
12.83 - 13.04 |
1.8524 times |
Wed 19 November 2025 |
12.82 (-0.85%) |
12.90 |
12.82 - 13.09 |
1.5545 times |
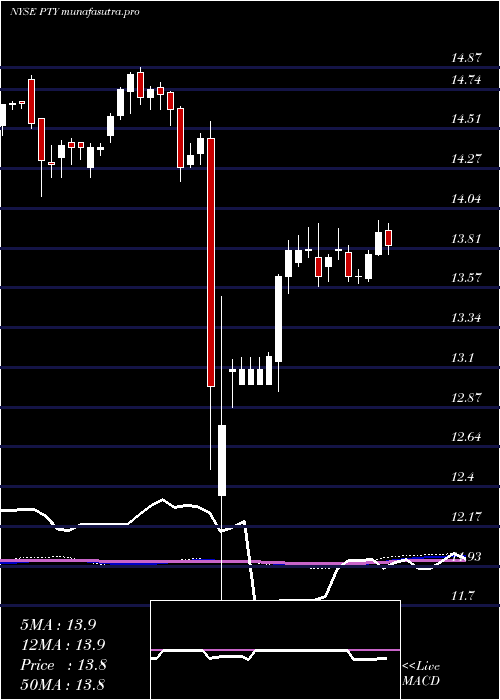
Weekly price and charts PimcoCorporate Strong weekly Stock price targets for PimcoCorporate PTY are 13.07 and 13.26 | Weekly Target 1 | 13.03 | | Weekly Target 2 | 13.11 | | Weekly Target 3 | 13.216666666667 | | Weekly Target 4 | 13.3 | | Weekly Target 5 | 13.41 |
Weekly price and volumes for Pimco Corporate
| Date |
Closing |
Open |
Range |
Volume |
Thu 04 December 2025 |
13.20 (-0.75%) |
13.26 |
13.13 - 13.32 |
0.8354 times |
Fri 28 November 2025 |
13.30 (1.45%) |
13.20 |
13.16 - 13.31 |
0.6418 times |
Fri 21 November 2025 |
13.11 (-2.16%) |
13.35 |
12.82 - 13.40 |
1.7899 times |
Fri 14 November 2025 |
13.40 (-1.76%) |
13.70 |
13.34 - 13.75 |
0.7746 times |
Fri 07 November 2025 |
13.64 (-1.09%) |
13.80 |
13.59 - 13.80 |
0.6346 times |
Fri 31 October 2025 |
13.79 (0%) |
13.76 |
13.71 - 13.79 |
0.2144 times |
Fri 31 October 2025 |
13.79 (-0.43%) |
13.90 |
13.51 - 13.90 |
1.3837 times |
Fri 24 October 2025 |
13.85 (-0.29%) |
13.90 |
13.07 - 14.00 |
1.9199 times |
Fri 17 October 2025 |
13.89 (-4.21%) |
14.53 |
13.69 - 14.57 |
1.4437 times |
Tue 07 October 2025 |
14.50 (0.28%) |
14.45 |
14.43 - 14.53 |
0.362 times |
Fri 03 October 2025 |
14.46 (0.28%) |
14.43 |
14.30 - 14.48 |
0.83 times |
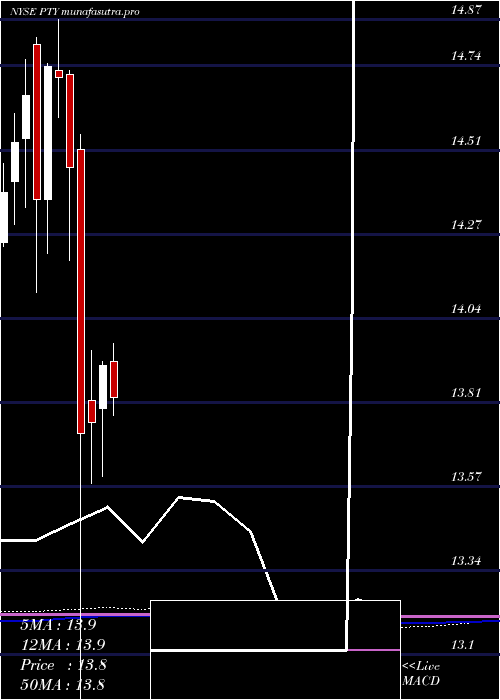
Monthly price and charts PimcoCorporate Strong monthly Stock price targets for PimcoCorporate PTY are 13.07 and 13.26 | Monthly Target 1 | 13.03 | | Monthly Target 2 | 13.11 | | Monthly Target 3 | 13.216666666667 | | Monthly Target 4 | 13.3 | | Monthly Target 5 | 13.41 |
Monthly price and volumes Pimco Corporate
| Date |
Closing |
Open |
Range |
Volume |
Thu 04 December 2025 |
13.20 (-0.75%) |
13.26 |
13.13 - 13.32 |
0.2426 times |
Fri 28 November 2025 |
13.30 (-3.55%) |
13.80 |
12.82 - 13.80 |
1.1152 times |
Fri 31 October 2025 |
13.79 (-4.5%) |
14.48 |
13.07 - 14.57 |
1.705 times |
Tue 30 September 2025 |
14.44 (2.05%) |
14.14 |
14.06 - 14.50 |
0.9019 times |
Fri 29 August 2025 |
14.15 (1.51%) |
13.95 |
13.89 - 14.15 |
0.8612 times |
Thu 31 July 2025 |
13.94 (0.22%) |
13.92 |
13.73 - 13.97 |
0.9118 times |
Mon 30 June 2025 |
13.91 (1.16%) |
13.79 |
13.60 - 13.92 |
0.8429 times |
Fri 30 May 2025 |
13.75 (0.22%) |
13.81 |
13.58 - 13.95 |
0.8712 times |
Wed 30 April 2025 |
13.72 (-5.12%) |
14.51 |
11.70 - 14.55 |
1.7074 times |
Mon 31 March 2025 |
14.46 (-1.7%) |
14.72 |
14.20 - 14.73 |
0.8408 times |
Fri 28 February 2025 |
14.71 (-0.2%) |
14.73 |
14.60 - 14.87 |
0.7851 times |
DMA SMA EMA moving averages of Pimco Corporate PTY
DMA (daily moving average) of Pimco Corporate PTY
| DMA period | DMA value | | 5 day DMA | 13.24 | | 12 day DMA | 13.15 | | 20 day DMA | 13.31 | | 35 day DMA | 13.5 | | 50 day DMA | 13.77 | | 100 day DMA | 13.91 | | 150 day DMA | 13.87 | | 200 day DMA | 13.9 | EMA (exponential moving average) of Pimco Corporate PTY
| EMA period | EMA current | EMA prev | EMA prev2 | | 5 day EMA | 13.21 | 13.22 | 13.23 | | 12 day EMA | 13.24 | 13.25 | 13.26 | | 20 day EMA | 13.34 | 13.35 | 13.36 | | 35 day EMA | 13.53 | 13.55 | 13.57 | | 50 day EMA | 13.78 | 13.8 | 13.82 |
SMA (simple moving average) of Pimco Corporate PTY
| SMA period | SMA current | SMA prev | SMA prev2 | | 5 day SMA | 13.24 | 13.25 | 13.27 | | 12 day SMA | 13.15 | 13.14 | 13.16 | | 20 day SMA | 13.31 | 13.33 | 13.36 | | 35 day SMA | 13.5 | 13.53 | 13.56 | | 50 day SMA | 13.77 | 13.8 | 13.82 | | 100 day SMA | 13.91 | 13.92 | 13.93 | | 150 day SMA | 13.87 | 13.87 | 13.87 | | 200 day SMA | 13.9 | 13.91 | 13.92 |
|
|
