PearsonPlc PSO full analysis,charts,indicators,moving averages,SMA,DMA,EMA,ADX,MACD,RSIPearson Plc PSO WideScreen charts, DMA,SMA,EMA technical analysis, forecast prediction, by indicators ADX,MACD,RSI,CCI NYSE stock exchange
operates under Consumer Services sector & deals in Books
Daily price and charts and targets PearsonPlc Strong Daily Stock price targets for PearsonPlc PSO are 13.1 and 13.28 | Daily Target 1 | 13.06 | | Daily Target 2 | 13.13 | | Daily Target 3 | 13.243333333333 | | Daily Target 4 | 13.31 | | Daily Target 5 | 13.42 |
Daily price and volume Pearson Plc
| Date |
Closing |
Open |
Range |
Volume |
Fri 05 December 2025 |
13.19 (-0.6%) |
13.26 |
13.18 - 13.36 |
0.7056 times |
Thu 04 December 2025 |
13.27 (0.91%) |
13.27 |
13.25 - 13.36 |
1.0612 times |
Wed 03 December 2025 |
13.15 (0.54%) |
13.21 |
13.13 - 13.26 |
0.9985 times |
Tue 02 December 2025 |
13.08 (-0.15%) |
13.07 |
13.05 - 13.16 |
0.9209 times |
Mon 01 December 2025 |
13.10 (-0.53%) |
13.10 |
13.06 - 13.19 |
0.9742 times |
Fri 28 November 2025 |
13.17 (1%) |
13.09 |
13.07 - 13.20 |
0.453 times |
Wed 26 November 2025 |
13.04 (0.23%) |
12.98 |
12.96 - 13.07 |
0.6291 times |
Tue 25 November 2025 |
13.01 (-0.91%) |
13.00 |
12.95 - 13.08 |
1.2189 times |
Mon 24 November 2025 |
13.13 (0.38%) |
13.11 |
13.02 - 13.17 |
2.1196 times |
Fri 21 November 2025 |
13.08 (1.71%) |
13.10 |
13.01 - 13.16 |
0.9191 times |
Thu 20 November 2025 |
12.86 (-1.23%) |
13.03 |
12.85 - 13.05 |
0.8326 times |
Weekly price and charts PearsonPlc Strong weekly Stock price targets for PearsonPlc PSO are 13.12 and 13.43 | Weekly Target 1 | 12.89 | | Weekly Target 2 | 13.04 | | Weekly Target 3 | 13.2 | | Weekly Target 4 | 13.35 | | Weekly Target 5 | 13.51 |
Weekly price and volumes for Pearson Plc
| Date |
Closing |
Open |
Range |
Volume |
Fri 05 December 2025 |
13.19 (0.15%) |
13.10 |
13.05 - 13.36 |
1.2478 times |
Fri 28 November 2025 |
13.17 (0.69%) |
13.11 |
12.95 - 13.20 |
1.1836 times |
Fri 21 November 2025 |
13.08 (-0.91%) |
13.34 |
12.85 - 13.37 |
1.2384 times |
Fri 14 November 2025 |
13.20 (1.07%) |
13.01 |
12.93 - 13.39 |
0.9984 times |
Fri 07 November 2025 |
13.06 (-6.11%) |
13.69 |
12.88 - 13.82 |
1.0799 times |
Fri 31 October 2025 |
13.91 (0%) |
13.92 |
13.84 - 13.96 |
0.1962 times |
Fri 31 October 2025 |
13.91 (-6.89%) |
14.93 |
13.84 - 14.95 |
1.1962 times |
Fri 24 October 2025 |
14.94 (-0.27%) |
14.70 |
14.58 - 15.06 |
1.0219 times |
Fri 17 October 2025 |
14.98 (6.62%) |
13.92 |
13.89 - 15.26 |
1.4642 times |
Tue 07 October 2025 |
14.05 (-1.4%) |
14.25 |
13.98 - 14.35 |
0.3734 times |
Fri 03 October 2025 |
14.25 (1.86%) |
14.10 |
14.07 - 14.46 |
1.2377 times |

Monthly price and charts PearsonPlc Strong monthly Stock price targets for PearsonPlc PSO are 13.12 and 13.43 | Monthly Target 1 | 12.89 | | Monthly Target 2 | 13.04 | | Monthly Target 3 | 13.2 | | Monthly Target 4 | 13.35 | | Monthly Target 5 | 13.51 |
Monthly price and volumes Pearson Plc
| Date |
Closing |
Open |
Range |
Volume |
Fri 05 December 2025 |
13.19 (0.15%) |
13.10 |
13.05 - 13.36 |
0.2907 times |
Fri 28 November 2025 |
13.17 (-5.32%) |
13.69 |
12.85 - 13.82 |
1.0485 times |
Fri 31 October 2025 |
13.91 (-1.77%) |
14.40 |
13.84 - 15.26 |
1.2084 times |
Tue 30 September 2025 |
14.16 (-2.81%) |
14.57 |
13.83 - 14.65 |
0.8353 times |
Fri 29 August 2025 |
14.57 (2.39%) |
15.24 |
14.22 - 15.25 |
0.948 times |
Thu 31 July 2025 |
14.23 (-4.69%) |
15.01 |
14.13 - 15.13 |
1.0606 times |
Mon 30 June 2025 |
14.93 (-6.39%) |
15.96 |
14.14 - 16.05 |
1.0941 times |
Fri 30 May 2025 |
15.95 (-1.85%) |
15.98 |
15.55 - 16.67 |
0.9746 times |
Wed 30 April 2025 |
16.25 (1.5%) |
16.01 |
14.69 - 16.27 |
1.6011 times |
Mon 31 March 2025 |
16.01 (-7.24%) |
17.20 |
15.31 - 17.90 |
0.9387 times |
Fri 28 February 2025 |
17.26 (3.54%) |
16.56 |
16.30 - 17.27 |
0.5079 times |

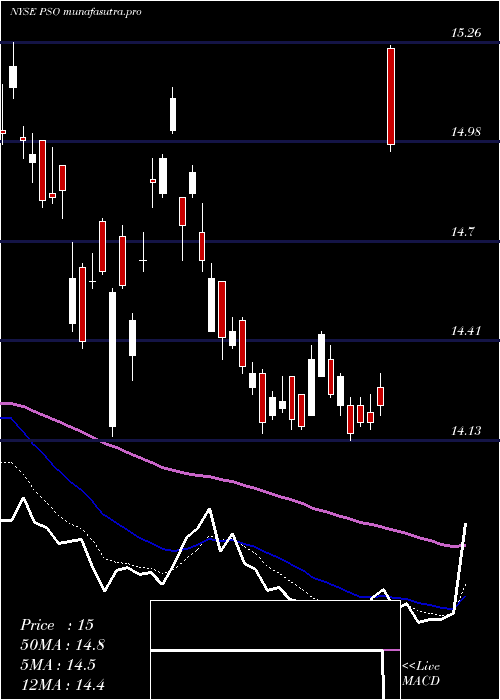
DMA SMA EMA moving averages of Pearson Plc PSO
DMA (daily moving average) of Pearson Plc PSO
| DMA period | DMA value | | 5 day DMA | 13.16 | | 12 day DMA | 13.09 | | 20 day DMA | 13.13 | | 35 day DMA | 13.65 | | 50 day DMA | 13.8 | | 100 day DMA | 14.1 | | 150 day DMA | 14.53 | | 200 day DMA | 14.95 | EMA (exponential moving average) of Pearson Plc PSO
| EMA period | EMA current | EMA prev | EMA prev2 | | 5 day EMA | 13.17 | 13.16 | 13.11 | | 12 day EMA | 13.17 | 13.17 | 13.15 | | 20 day EMA | 13.26 | 13.27 | 13.27 | | 35 day EMA | 13.48 | 13.5 | 13.51 | | 50 day EMA | 13.76 | 13.78 | 13.8 |
SMA (simple moving average) of Pearson Plc PSO
| SMA period | SMA current | SMA prev | SMA prev2 | | 5 day SMA | 13.16 | 13.15 | 13.11 | | 12 day SMA | 13.09 | 13.09 | 13.08 | | 20 day SMA | 13.13 | 13.13 | 13.15 | | 35 day SMA | 13.65 | 13.69 | 13.73 | | 50 day SMA | 13.8 | 13.82 | 13.83 | | 100 day SMA | 14.1 | 14.11 | 14.12 | | 150 day SMA | 14.53 | 14.54 | 14.56 | | 200 day SMA | 14.95 | 14.97 | 14.99 |
|
|
