ParsonsCorp PSN full analysis,charts,indicators,moving averages,SMA,DMA,EMA,ADX,MACD,RSIParsons Corp PSN WideScreen charts, DMA,SMA,EMA technical analysis, forecast prediction, by indicators ADX,MACD,RSI,CCI NYSE stock exchange
Daily price and charts and targets ParsonsCorp Strong Daily Stock price targets for ParsonsCorp PSN are 53.43 and 75.56 | Daily Target 1 | 49.02 | | Daily Target 2 | 57.83 | | Daily Target 3 | 71.146666666667 | | Daily Target 4 | 79.96 | | Daily Target 5 | 93.28 |
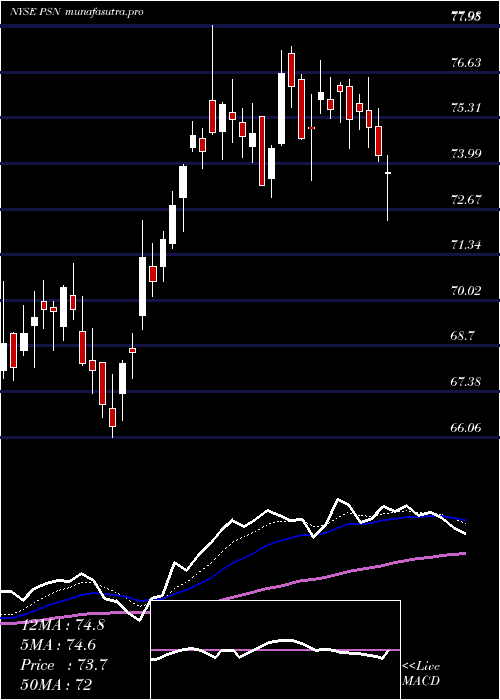
Daily price and volume Parsons Corp
| Date |
Closing |
Open |
Range |
Volume |
Fri 05 December 2025 |
66.65 (-21.09%) |
84.46 |
62.33 - 84.46 |
5.4035 times |
Thu 04 December 2025 |
84.46 (1.88%) |
84.21 |
83.05 - 86.70 |
0.6182 times |
Wed 03 December 2025 |
82.90 (0.02%) |
83.75 |
81.55 - 83.75 |
0.4879 times |
Tue 02 December 2025 |
82.88 (0.23%) |
82.83 |
82.28 - 84.18 |
0.5071 times |
Mon 01 December 2025 |
82.69 (-2.35%) |
84.12 |
82.61 - 84.99 |
0.492 times |
Fri 28 November 2025 |
84.68 (0.65%) |
83.28 |
83.28 - 85.00 |
0.3306 times |
Wed 26 November 2025 |
84.13 (-0.1%) |
84.09 |
83.82 - 85.00 |
0.4299 times |
Tue 25 November 2025 |
84.21 (1.38%) |
84.16 |
83.09 - 84.86 |
0.7452 times |
Mon 24 November 2025 |
83.06 (1.69%) |
81.59 |
80.44 - 83.19 |
0.4393 times |
Fri 21 November 2025 |
81.68 (-0.39%) |
81.79 |
80.52 - 82.74 |
0.5463 times |
Thu 20 November 2025 |
82.00 (-1.55%) |
84.76 |
81.63 - 85.87 |
0.6476 times |
Weekly price and charts ParsonsCorp Strong weekly Stock price targets for ParsonsCorp PSN are 52.31 and 76.68 | Weekly Target 1 | 47.52 | | Weekly Target 2 | 57.09 | | Weekly Target 3 | 71.893333333333 | | Weekly Target 4 | 81.46 | | Weekly Target 5 | 96.26 |
Weekly price and volumes for Parsons Corp
| Date |
Closing |
Open |
Range |
Volume |
Fri 05 December 2025 |
66.65 (-21.29%) |
84.12 |
62.33 - 86.70 |
2.6846 times |
Fri 28 November 2025 |
84.68 (3.67%) |
81.59 |
80.44 - 85.00 |
0.6954 times |
Fri 21 November 2025 |
81.68 (-1.15%) |
82.14 |
80.52 - 85.87 |
0.9404 times |
Fri 14 November 2025 |
82.63 (-3.84%) |
87.54 |
82.18 - 88.00 |
1.1978 times |
Fri 07 November 2025 |
85.93 (3.36%) |
79.12 |
77.45 - 86.38 |
1.189 times |
Fri 31 October 2025 |
83.14 (0%) |
82.78 |
82.32 - 83.85 |
0.1695 times |
Fri 31 October 2025 |
83.14 (-1.21%) |
84.46 |
82.32 - 84.89 |
0.6972 times |
Fri 24 October 2025 |
84.16 (1.72%) |
83.70 |
82.10 - 85.96 |
0.7688 times |
Fri 17 October 2025 |
82.74 (-3.62%) |
86.00 |
81.87 - 87.43 |
0.8369 times |
Fri 10 October 2025 |
85.85 (-1.86%) |
88.38 |
85.68 - 89.50 |
0.8204 times |
Fri 03 October 2025 |
87.48 (7.39%) |
81.95 |
81.67 - 88.53 |
1.2088 times |

Monthly price and charts ParsonsCorp Strong monthly Stock price targets for ParsonsCorp PSN are 52.31 and 76.68 | Monthly Target 1 | 47.52 | | Monthly Target 2 | 57.09 | | Monthly Target 3 | 71.893333333333 | | Monthly Target 4 | 81.46 | | Monthly Target 5 | 96.26 |
Monthly price and volumes Parsons Corp
| Date |
Closing |
Open |
Range |
Volume |
Fri 05 December 2025 |
66.65 (-21.29%) |
84.12 |
62.33 - 86.70 |
0.522 times |
Fri 28 November 2025 |
84.68 (1.85%) |
79.12 |
77.45 - 88.00 |
0.7822 times |
Fri 31 October 2025 |
83.14 (0.27%) |
82.53 |
81.87 - 89.50 |
0.7927 times |
Tue 30 September 2025 |
82.92 (3.52%) |
79.47 |
73.50 - 83.49 |
1.0671 times |
Fri 29 August 2025 |
80.10 (7.95%) |
73.69 |
72.34 - 82.25 |
0.8783 times |
Thu 31 July 2025 |
74.20 (3.39%) |
71.68 |
71.53 - 77.98 |
0.9163 times |
Mon 30 June 2025 |
71.77 (10.69%) |
64.39 |
61.75 - 72.33 |
1.1907 times |
Fri 30 May 2025 |
64.84 (-3.02%) |
65.87 |
60.09 - 70.11 |
1.3577 times |
Wed 30 April 2025 |
66.86 (12.92%) |
59.50 |
56.27 - 71.10 |
1.35 times |
Mon 31 March 2025 |
59.21 (1.7%) |
57.89 |
54.56 - 62.07 |
1.143 times |
Fri 28 February 2025 |
58.22 (-26.55%) |
77.66 |
56.87 - 79.33 |
1.4676 times |

DMA SMA EMA moving averages of Parsons Corp PSN
DMA (daily moving average) of Parsons Corp PSN
| DMA period | DMA value | | 5 day DMA | 79.92 | | 12 day DMA | 81.89 | | 20 day DMA | 82.98 | | 35 day DMA | 83.04 | | 50 day DMA | 83.74 | | 100 day DMA | 80.78 | | 150 day DMA | 76.78 | | 200 day DMA | 72.93 | EMA (exponential moving average) of Parsons Corp PSN
| EMA period | EMA current | EMA prev | EMA prev2 | | 5 day EMA | 77.94 | 83.59 | 83.16 | | 12 day EMA | 80.9 | 83.49 | 83.31 | | 20 day EMA | 81.89 | 83.49 | 83.39 | | 35 day EMA | 82.74 | 83.69 | 83.64 | | 50 day EMA | 83.08 | 83.75 | 83.72 |
SMA (simple moving average) of Parsons Corp PSN
| SMA period | SMA current | SMA prev | SMA prev2 | | 5 day SMA | 79.92 | 83.52 | 83.46 | | 12 day SMA | 81.89 | 83.22 | 82.97 | | 20 day SMA | 82.98 | 83.75 | 83.67 | | 35 day SMA | 83.04 | 83.52 | 83.51 | | 50 day SMA | 83.74 | 84.01 | 83.93 | | 100 day SMA | 80.78 | 80.86 | 80.75 | | 150 day SMA | 76.78 | 76.76 | 76.65 | | 200 day SMA | 72.93 | 72.91 | 72.81 |
|
|
