PutnamPremier PPT full analysis,charts,indicators,moving averages,SMA,DMA,EMA,ADX,MACD,RSIPutnam Premier PPT WideScreen charts, DMA,SMA,EMA technical analysis, forecast prediction, by indicators ADX,MACD,RSI,CCI NYSE stock exchange
operates under N A sector & deals in N A
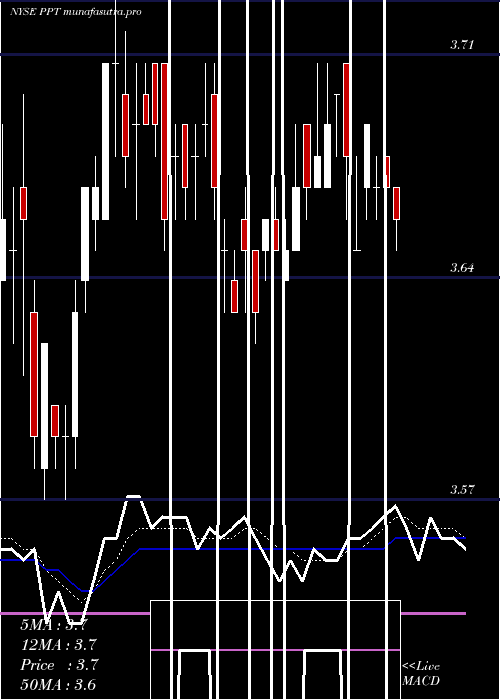
Daily price and charts and targets PutnamPremier Strong Daily Stock price targets for PutnamPremier PPT are 3.54 and 3.59 | Daily Target 1 | 3.52 | | Daily Target 2 | 3.55 | | Daily Target 3 | 3.5733333333333 | | Daily Target 4 | 3.6 | | Daily Target 5 | 3.62 |
Daily price and volume Putnam Premier
| Date |
Closing |
Open |
Range |
Volume |
Fri 05 December 2025 |
3.57 (-0.83%) |
3.58 |
3.55 - 3.60 |
2.7281 times |
Thu 04 December 2025 |
3.60 (-0.55%) |
3.62 |
3.60 - 3.62 |
1.3145 times |
Wed 03 December 2025 |
3.62 (0.28%) |
3.60 |
3.59 - 3.62 |
0.721 times |
Tue 02 December 2025 |
3.61 (-0.28%) |
3.62 |
3.59 - 3.64 |
0.9421 times |
Mon 01 December 2025 |
3.62 (-0.55%) |
3.62 |
3.62 - 3.64 |
0.7684 times |
Fri 28 November 2025 |
3.64 (1.11%) |
3.62 |
3.62 - 3.65 |
1.0757 times |
Wed 26 November 2025 |
3.60 (-0.83%) |
3.61 |
3.60 - 3.64 |
1.1636 times |
Tue 25 November 2025 |
3.63 (1.4%) |
3.59 |
3.59 - 3.63 |
0.4667 times |
Mon 24 November 2025 |
3.58 (0.28%) |
3.57 |
3.56 - 3.59 |
0.4853 times |
Fri 21 November 2025 |
3.57 (0.28%) |
3.56 |
3.56 - 3.58 |
0.3344 times |
Thu 20 November 2025 |
3.56 (0.56%) |
3.55 |
3.54 - 3.59 |
0.7883 times |
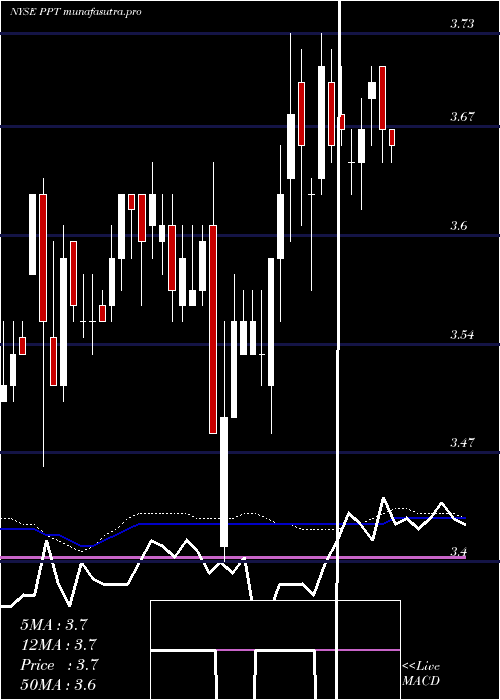
Weekly price and charts PutnamPremier Strong weekly Stock price targets for PutnamPremier PPT are 3.52 and 3.61 | Weekly Target 1 | 3.5 | | Weekly Target 2 | 3.53 | | Weekly Target 3 | 3.5866666666667 | | Weekly Target 4 | 3.62 | | Weekly Target 5 | 3.68 |
Weekly price and volumes for Putnam Premier
| Date |
Closing |
Open |
Range |
Volume |
Fri 05 December 2025 |
3.57 (-1.92%) |
3.62 |
3.55 - 3.64 |
1.8498 times |
Fri 28 November 2025 |
3.64 (1.96%) |
3.57 |
3.56 - 3.65 |
0.9118 times |
Fri 21 November 2025 |
3.57 (-1.38%) |
3.59 |
3.54 - 3.61 |
0.9851 times |
Fri 14 November 2025 |
3.62 (0%) |
3.63 |
3.61 - 3.66 |
1.5048 times |
Fri 07 November 2025 |
3.62 (-1.09%) |
3.61 |
3.60 - 3.64 |
0.9546 times |
Fri 31 October 2025 |
3.66 (0%) |
3.66 |
3.64 - 3.67 |
0.1592 times |
Fri 31 October 2025 |
3.66 (0.83%) |
3.64 |
3.61 - 3.67 |
0.9519 times |
Fri 24 October 2025 |
3.63 (0.55%) |
3.61 |
3.61 - 3.67 |
1.4108 times |
Fri 17 October 2025 |
3.61 (-2.96%) |
3.69 |
3.60 - 3.70 |
0.7907 times |
Tue 07 October 2025 |
3.72 (1.64%) |
3.68 |
3.66 - 3.74 |
0.4814 times |
Fri 03 October 2025 |
3.66 (-0.27%) |
3.68 |
3.64 - 3.73 |
2.1786 times |
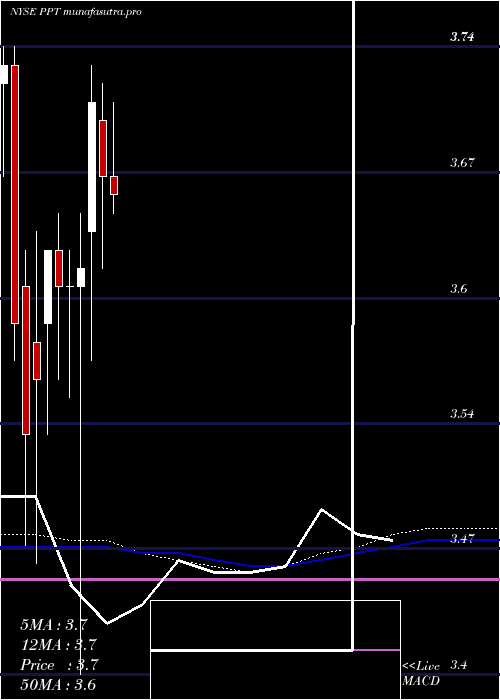
Monthly price and charts PutnamPremier Strong monthly Stock price targets for PutnamPremier PPT are 3.52 and 3.61 | Monthly Target 1 | 3.5 | | Monthly Target 2 | 3.53 | | Monthly Target 3 | 3.5866666666667 | | Monthly Target 4 | 3.62 | | Monthly Target 5 | 3.68 |
Monthly price and volumes Putnam Premier
| Date |
Closing |
Open |
Range |
Volume |
Fri 05 December 2025 |
3.57 (-1.92%) |
3.62 |
3.55 - 3.64 |
0.3897 times |
Fri 28 November 2025 |
3.64 (-0.55%) |
3.61 |
3.54 - 3.66 |
0.9177 times |
Fri 31 October 2025 |
3.66 (-0.81%) |
3.68 |
3.60 - 3.74 |
1.0282 times |
Tue 30 September 2025 |
3.69 (0%) |
3.69 |
3.64 - 3.77 |
1.2449 times |
Fri 29 August 2025 |
3.69 (0.82%) |
3.67 |
3.64 - 3.73 |
0.9795 times |
Thu 31 July 2025 |
3.66 (-0.27%) |
3.67 |
3.59 - 3.71 |
1.2713 times |
Mon 30 June 2025 |
3.67 (-1.08%) |
3.70 |
3.62 - 3.72 |
0.9591 times |
Fri 30 May 2025 |
3.71 (2.49%) |
3.64 |
3.57 - 3.73 |
1.0525 times |
Wed 30 April 2025 |
3.62 (0.28%) |
3.61 |
3.40 - 3.65 |
1.1744 times |
Mon 31 March 2025 |
3.61 (0%) |
3.61 |
3.55 - 3.63 |
0.9827 times |
Fri 28 February 2025 |
3.61 (-0.55%) |
3.63 |
3.56 - 3.65 |
0.8297 times |
DMA SMA EMA moving averages of Putnam Premier PPT
DMA (daily moving average) of Putnam Premier PPT
| DMA period | DMA value | | 5 day DMA | 3.6 | | 12 day DMA | 3.6 | | 20 day DMA | 3.61 | | 35 day DMA | 3.62 | | 50 day DMA | 3.64 | | 100 day DMA | 3.66 | | 150 day DMA | 3.66 | | 200 day DMA | 3.64 | EMA (exponential moving average) of Putnam Premier PPT
| EMA period | EMA current | EMA prev | EMA prev2 | | 5 day EMA | 3.6 | 3.61 | 3.61 | | 12 day EMA | 3.6 | 3.61 | 3.61 | | 20 day EMA | 3.62 | 3.62 | 3.62 | | 35 day EMA | 3.65 | 3.65 | 3.65 | | 50 day EMA | 3.65 | 3.65 | 3.65 |
SMA (simple moving average) of Putnam Premier PPT
| SMA period | SMA current | SMA prev | SMA prev2 | | 5 day SMA | 3.6 | 3.62 | 3.62 | | 12 day SMA | 3.6 | 3.6 | 3.6 | | 20 day SMA | 3.61 | 3.61 | 3.61 | | 35 day SMA | 3.62 | 3.62 | 3.62 | | 50 day SMA | 3.64 | 3.64 | 3.64 | | 100 day SMA | 3.66 | 3.66 | 3.66 | | 150 day SMA | 3.66 | 3.66 | 3.66 | | 200 day SMA | 3.64 | 3.64 | 3.64 |
|
|
