PncFinancial PNC full analysis,charts,indicators,moving averages,SMA,DMA,EMA,ADX,MACD,RSIPnc Financial PNC WideScreen charts, DMA,SMA,EMA technical analysis, forecast prediction, by indicators ADX,MACD,RSI,CCI NYSE stock exchange
operates under Finance sector & deals in Major Banks
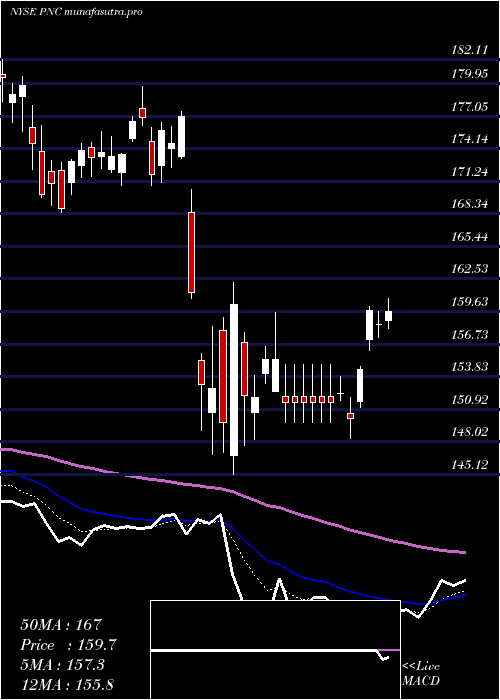
Daily price and charts and targets PncFinancial Strong Daily Stock price targets for PncFinancial PNC are 198.02 and 199.81 | Daily Target 1 | 196.74 | | Daily Target 2 | 197.51 | | Daily Target 3 | 198.53333333333 | | Daily Target 4 | 199.3 | | Daily Target 5 | 200.32 |
Daily price and volume Pnc Financial
| Date |
Closing |
Open |
Range |
Volume |
Thu 04 December 2025 |
198.27 (0.14%) |
198.00 |
197.77 - 199.56 |
1.0532 times |
Wed 03 December 2025 |
198.00 (3.1%) |
192.62 |
192.00 - 198.16 |
1.0011 times |
Tue 02 December 2025 |
192.05 (-0.18%) |
192.49 |
191.37 - 193.45 |
0.7093 times |
Mon 01 December 2025 |
192.40 (0.88%) |
190.38 |
190.01 - 193.85 |
0.757 times |
Fri 28 November 2025 |
190.72 (-0.58%) |
191.73 |
190.66 - 192.60 |
0.4819 times |
Wed 26 November 2025 |
191.83 (-0.39%) |
192.14 |
191.82 - 194.09 |
0.3387 times |
Tue 25 November 2025 |
192.59 (2.16%) |
190.00 |
188.50 - 193.83 |
1.0262 times |
Mon 24 November 2025 |
188.52 (0.82%) |
186.64 |
185.47 - 189.45 |
1.8622 times |
Fri 21 November 2025 |
186.99 (1.88%) |
184.05 |
183.90 - 189.34 |
1.2985 times |
Thu 20 November 2025 |
183.54 (0.31%) |
184.60 |
182.92 - 187.22 |
1.4719 times |
Wed 19 November 2025 |
182.97 (1.6%) |
180.36 |
180.00 - 183.40 |
1.1849 times |
Weekly price and charts PncFinancial Strong weekly Stock price targets for PncFinancial PNC are 194.14 and 203.69 | Weekly Target 1 | 186.4 | | Weekly Target 2 | 192.33 | | Weekly Target 3 | 195.94666666667 | | Weekly Target 4 | 201.88 | | Weekly Target 5 | 205.5 |
Weekly price and volumes for Pnc Financial
| Date |
Closing |
Open |
Range |
Volume |
Thu 04 December 2025 |
198.27 (3.96%) |
190.38 |
190.01 - 199.56 |
0.7311 times |
Fri 28 November 2025 |
190.72 (1.99%) |
186.64 |
185.47 - 194.09 |
0.7703 times |
Fri 21 November 2025 |
186.99 (1.63%) |
183.38 |
177.08 - 189.34 |
1.2998 times |
Fri 14 November 2025 |
183.99 (-0.11%) |
184.27 |
181.72 - 188.08 |
0.8555 times |
Fri 07 November 2025 |
184.20 (0.9%) |
181.63 |
180.48 - 185.29 |
0.6937 times |
Fri 31 October 2025 |
182.55 (0%) |
181.01 |
180.40 - 183.21 |
0.1753 times |
Fri 31 October 2025 |
182.55 (-2.09%) |
186.78 |
180.03 - 186.85 |
1.1631 times |
Fri 24 October 2025 |
186.44 (3.92%) |
180.22 |
179.72 - 187.33 |
1.37 times |
Fri 17 October 2025 |
179.40 (-2.47%) |
186.45 |
176.88 - 190.40 |
1.9329 times |
Fri 10 October 2025 |
183.95 (-7.31%) |
198.90 |
183.62 - 202.00 |
1.0083 times |
Fri 03 October 2025 |
198.46 (-2.39%) |
203.92 |
196.62 - 204.05 |
0.7195 times |
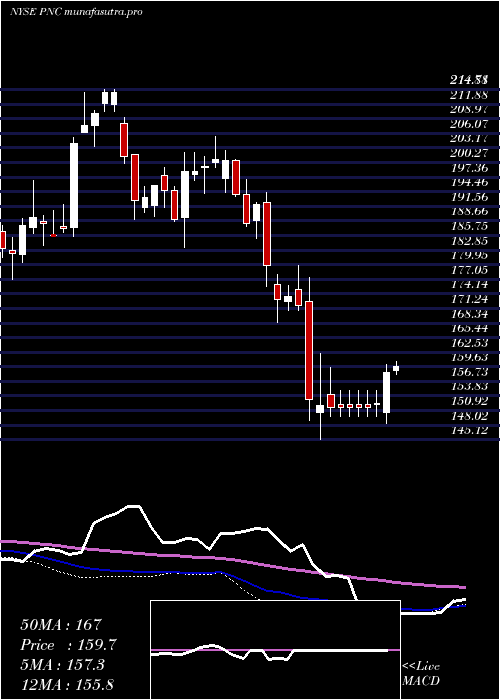
Monthly price and charts PncFinancial Strong monthly Stock price targets for PncFinancial PNC are 194.14 and 203.69 | Monthly Target 1 | 186.4 | | Monthly Target 2 | 192.33 | | Monthly Target 3 | 195.94666666667 | | Monthly Target 4 | 201.88 | | Monthly Target 5 | 205.5 |
Monthly price and volumes Pnc Financial
| Date |
Closing |
Open |
Range |
Volume |
Thu 04 December 2025 |
198.27 (3.96%) |
190.38 |
190.01 - 199.56 |
0.1587 times |
Fri 28 November 2025 |
190.72 (4.48%) |
181.63 |
177.08 - 194.09 |
0.7858 times |
Fri 31 October 2025 |
182.55 (-9.15%) |
199.62 |
176.88 - 202.00 |
1.3057 times |
Tue 30 September 2025 |
200.93 (-3.14%) |
205.71 |
197.40 - 208.80 |
0.7551 times |
Fri 29 August 2025 |
207.44 (9.02%) |
187.45 |
183.84 - 208.34 |
0.8326 times |
Thu 31 July 2025 |
190.27 (2.07%) |
186.04 |
186.01 - 200.95 |
1.4089 times |
Mon 30 June 2025 |
186.42 (7.26%) |
173.15 |
170.49 - 187.73 |
0.9641 times |
Fri 30 May 2025 |
173.81 (8.16%) |
159.93 |
158.92 - 180.34 |
1.06 times |
Wed 30 April 2025 |
160.69 (-8.58%) |
174.16 |
145.12 - 177.42 |
1.478 times |
Mon 31 March 2025 |
175.77 (-8.41%) |
192.35 |
168.44 - 194.27 |
1.251 times |
Fri 28 February 2025 |
191.92 (-4.49%) |
197.19 |
185.10 - 202.75 |
0.8313 times |

DMA SMA EMA moving averages of Pnc Financial PNC
DMA (daily moving average) of Pnc Financial PNC
| DMA period | DMA value | | 5 day DMA | 194.29 | | 12 day DMA | 189.83 | | 20 day DMA | 187.45 | | 35 day DMA | 185.25 | | 50 day DMA | 188.02 | | 100 day DMA | 193.09 | | 150 day DMA | 188.52 | | 200 day DMA | 183.26 | EMA (exponential moving average) of Pnc Financial PNC
| EMA period | EMA current | EMA prev | EMA prev2 | | 5 day EMA | 195.02 | 193.39 | 191.09 | | 12 day EMA | 191.36 | 190.1 | 188.66 | | 20 day EMA | 189.47 | 188.54 | 187.55 | | 35 day EMA | 189.49 | 188.97 | 188.44 | | 50 day EMA | 190.04 | 189.7 | 189.36 |
SMA (simple moving average) of Pnc Financial PNC
| SMA period | SMA current | SMA prev | SMA prev2 | | 5 day SMA | 194.29 | 193 | 191.92 | | 12 day SMA | 189.83 | 188.23 | 187.06 | | 20 day SMA | 187.45 | 186.74 | 185.99 | | 35 day SMA | 185.25 | 184.79 | 184.56 | | 50 day SMA | 188.02 | 188.13 | 188.25 | | 100 day SMA | 193.09 | 193.03 | 193.02 | | 150 day SMA | 188.52 | 188.27 | 188.02 | | 200 day SMA | 183.26 | 183.22 | 183.21 |
|
|
