PutnamMunicipal PMO full analysis,charts,indicators,moving averages,SMA,DMA,EMA,ADX,MACD,RSIPutnam Municipal PMO WideScreen charts, DMA,SMA,EMA technical analysis, forecast prediction, by indicators ADX,MACD,RSI,CCI NYSE stock exchange
operates under N A sector & deals in N A
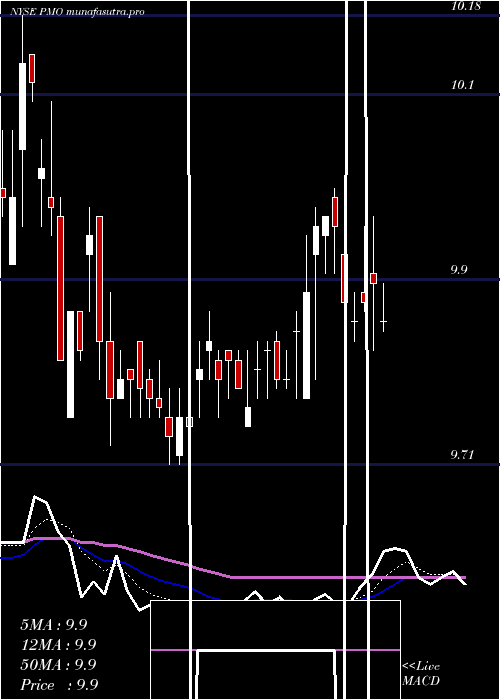
Daily price and charts and targets PutnamMunicipal Strong Daily Stock price targets for PutnamMunicipal PMO are 10.48 and 10.64 | Daily Target 1 | 10.35 | | Daily Target 2 | 10.44 | | Daily Target 3 | 10.51 | | Daily Target 4 | 10.6 | | Daily Target 5 | 10.67 |
Daily price and volume Putnam Municipal
| Date |
Closing |
Open |
Range |
Volume |
Thu 04 December 2025 |
10.53 (0.67%) |
10.42 |
10.42 - 10.58 |
2.2008 times |
Wed 03 December 2025 |
10.46 (0.77%) |
10.40 |
10.36 - 10.50 |
1.3523 times |
Tue 02 December 2025 |
10.38 (0.1%) |
10.36 |
10.31 - 10.38 |
0.6755 times |
Mon 01 December 2025 |
10.37 (0%) |
10.40 |
10.32 - 10.41 |
1.2374 times |
Fri 28 November 2025 |
10.37 (0.1%) |
10.37 |
10.35 - 10.39 |
0.5063 times |
Wed 26 November 2025 |
10.36 (0.19%) |
10.37 |
10.32 - 10.37 |
0.4558 times |
Tue 25 November 2025 |
10.34 (0.29%) |
10.36 |
10.31 - 10.36 |
0.6654 times |
Mon 24 November 2025 |
10.31 (0.19%) |
10.28 |
10.28 - 10.33 |
0.7235 times |
Fri 21 November 2025 |
10.29 (0.1%) |
10.31 |
10.24 - 10.31 |
0.4545 times |
Thu 20 November 2025 |
10.28 (-0.19%) |
10.34 |
10.24 - 10.34 |
1.7285 times |
Wed 19 November 2025 |
10.30 (-0.58%) |
10.32 |
10.30 - 10.36 |
0.7929 times |
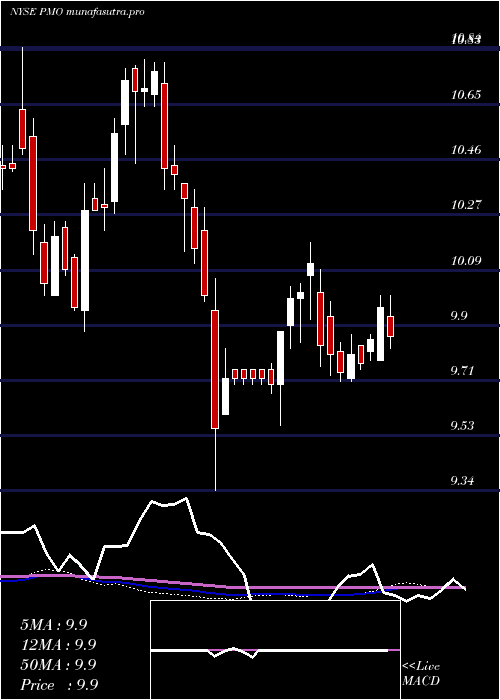
Weekly price and charts PutnamMunicipal Strong weekly Stock price targets for PutnamMunicipal PMO are 10.42 and 10.69 | Weekly Target 1 | 10.2 | | Weekly Target 2 | 10.37 | | Weekly Target 3 | 10.473333333333 | | Weekly Target 4 | 10.64 | | Weekly Target 5 | 10.74 |
Weekly price and volumes for Putnam Municipal
| Date |
Closing |
Open |
Range |
Volume |
Thu 04 December 2025 |
10.53 (1.54%) |
10.40 |
10.31 - 10.58 |
1.701 times |
Fri 28 November 2025 |
10.37 (0.78%) |
10.28 |
10.28 - 10.39 |
0.7317 times |
Fri 21 November 2025 |
10.29 (-1.06%) |
10.38 |
10.24 - 10.39 |
1.5506 times |
Fri 14 November 2025 |
10.40 (0.68%) |
10.36 |
10.33 - 10.45 |
1.5097 times |
Fri 07 November 2025 |
10.33 (-0.39%) |
10.36 |
10.28 - 10.44 |
0.8099 times |
Fri 31 October 2025 |
10.37 (0%) |
10.36 |
10.33 - 10.42 |
0.1556 times |
Fri 31 October 2025 |
10.37 (-0.19%) |
10.40 |
10.30 - 10.45 |
1.2865 times |
Fri 24 October 2025 |
10.39 (0.48%) |
10.37 |
10.30 - 10.46 |
1.1097 times |
Fri 17 October 2025 |
10.34 (0.88%) |
10.32 |
10.32 - 10.50 |
0.6841 times |
Tue 07 October 2025 |
10.25 (0.1%) |
10.21 |
10.17 - 10.28 |
0.4613 times |
Fri 03 October 2025 |
10.24 (-0.1%) |
10.29 |
10.22 - 10.50 |
1.2922 times |
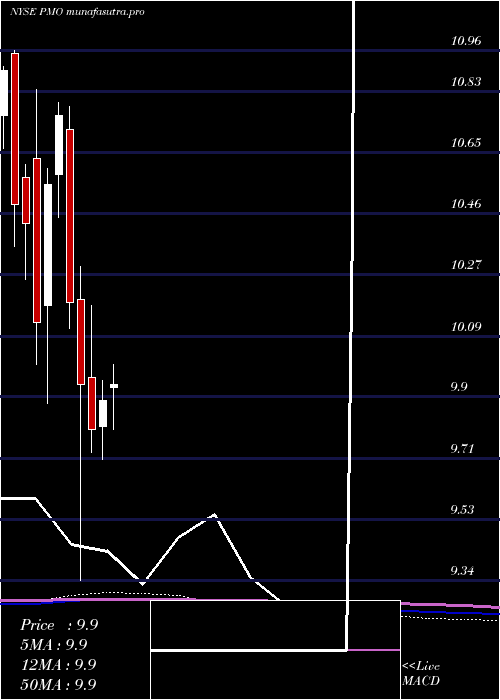
Monthly price and charts PutnamMunicipal Strong monthly Stock price targets for PutnamMunicipal PMO are 10.42 and 10.69 | Monthly Target 1 | 10.2 | | Monthly Target 2 | 10.37 | | Monthly Target 3 | 10.473333333333 | | Monthly Target 4 | 10.64 | | Monthly Target 5 | 10.74 |
Monthly price and volumes Putnam Municipal
| Date |
Closing |
Open |
Range |
Volume |
Thu 04 December 2025 |
10.53 (1.54%) |
10.40 |
10.31 - 10.58 |
0.3208 times |
Fri 28 November 2025 |
10.37 (0%) |
10.36 |
10.24 - 10.45 |
0.8678 times |
Fri 31 October 2025 |
10.37 (0.39%) |
10.37 |
10.17 - 10.50 |
0.8619 times |
Tue 30 September 2025 |
10.33 (4.24%) |
9.82 |
9.80 - 10.51 |
0.9555 times |
Fri 29 August 2025 |
9.91 (1.43%) |
9.79 |
9.72 - 9.96 |
1.3 times |
Thu 31 July 2025 |
9.77 (-1.21%) |
9.93 |
9.71 - 10.00 |
0.9557 times |
Mon 30 June 2025 |
9.89 (0.92%) |
9.81 |
9.71 - 9.95 |
0.9645 times |
Fri 30 May 2025 |
9.80 (-1.41%) |
9.96 |
9.73 - 10.18 |
1.1229 times |
Wed 30 April 2025 |
9.94 (-2.45%) |
10.20 |
9.34 - 10.30 |
1.5633 times |
Mon 31 March 2025 |
10.19 (-5.3%) |
10.72 |
10.11 - 10.79 |
1.0877 times |
Fri 28 February 2025 |
10.76 (1.99%) |
10.58 |
10.45 - 10.80 |
0.8767 times |
DMA SMA EMA moving averages of Putnam Municipal PMO
DMA (daily moving average) of Putnam Municipal PMO
| DMA period | DMA value | | 5 day DMA | 10.42 | | 12 day DMA | 10.36 | | 20 day DMA | 10.37 | | 35 day DMA | 10.37 | | 50 day DMA | 10.35 | | 100 day DMA | 10.14 | | 150 day DMA | 10.06 | | 200 day DMA | 10.08 | EMA (exponential moving average) of Putnam Municipal PMO
| EMA period | EMA current | EMA prev | EMA prev2 | | 5 day EMA | 10.44 | 10.4 | 10.37 | | 12 day EMA | 10.39 | 10.37 | 10.35 | | 20 day EMA | 10.37 | 10.35 | 10.34 | | 35 day EMA | 10.37 | 10.36 | 10.35 | | 50 day EMA | 10.36 | 10.35 | 10.35 |
SMA (simple moving average) of Putnam Municipal PMO
| SMA period | SMA current | SMA prev | SMA prev2 | | 5 day SMA | 10.42 | 10.39 | 10.36 | | 12 day SMA | 10.36 | 10.35 | 10.34 | | 20 day SMA | 10.37 | 10.36 | 10.36 | | 35 day SMA | 10.37 | 10.37 | 10.37 | | 50 day SMA | 10.35 | 10.35 | 10.35 | | 100 day SMA | 10.14 | 10.14 | 10.13 | | 150 day SMA | 10.06 | 10.05 | 10.05 | | 200 day SMA | 10.08 | 10.08 | 10.09 |
|
|
