PlymouthIndustrial PLYM full analysis,charts,indicators,moving averages,SMA,DMA,EMA,ADX,MACD,RSIPlymouth Industrial PLYM WideScreen charts, DMA,SMA,EMA technical analysis, forecast prediction, by indicators ADX,MACD,RSI,CCI NYSE stock exchange
Daily price and charts and targets PlymouthIndustrial Strong Daily Stock price targets for PlymouthIndustrial PLYM are 21.83 and 21.9 | Daily Target 1 | 21.82 | | Daily Target 2 | 21.84 | | Daily Target 3 | 21.886666666667 | | Daily Target 4 | 21.91 | | Daily Target 5 | 21.96 |
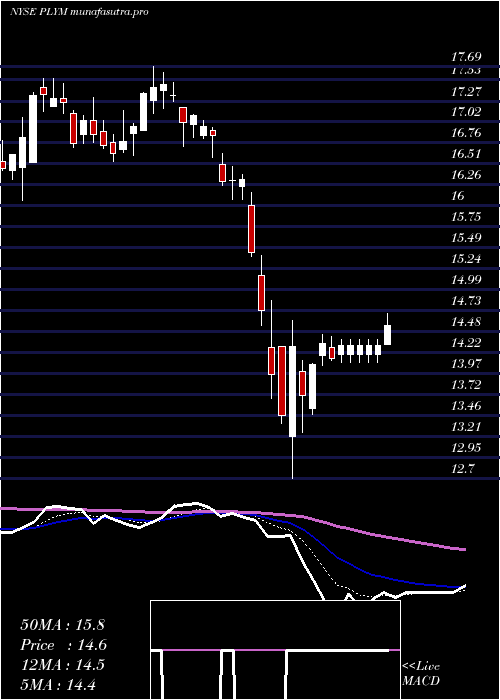
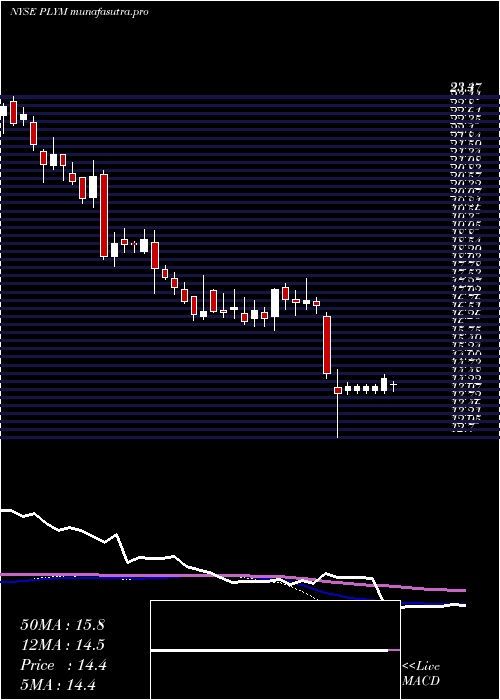
Daily price and volume Plymouth Industrial
| Date |
Closing |
Open |
Range |
Volume |
Fri 05 December 2025 |
21.87 (-0.18%) |
21.93 |
21.86 - 21.93 |
0.2086 times |
Thu 04 December 2025 |
21.91 (-0.32%) |
21.95 |
21.83 - 22.00 |
0.7485 times |
Wed 03 December 2025 |
21.98 (0.18%) |
22.00 |
21.93 - 22.00 |
0.6125 times |
Tue 02 December 2025 |
21.94 (-0.14%) |
21.96 |
21.91 - 21.97 |
0.8107 times |
Mon 01 December 2025 |
21.97 (0.14%) |
22.00 |
21.90 - 22.00 |
1.2086 times |
Fri 28 November 2025 |
21.94 (-0.27%) |
22.05 |
21.90 - 22.25 |
1.3661 times |
Wed 26 November 2025 |
22.00 (-3%) |
22.10 |
21.90 - 22.20 |
2.656 times |
Tue 25 November 2025 |
22.68 (2.25%) |
22.24 |
22.19 - 22.74 |
1.2485 times |
Mon 24 November 2025 |
22.18 (-0.22%) |
22.25 |
22.15 - 22.25 |
0.6497 times |
Fri 21 November 2025 |
22.23 (0.91%) |
22.06 |
22.06 - 22.25 |
0.4906 times |
Thu 20 November 2025 |
22.03 (-0.59%) |
22.24 |
21.95 - 22.30 |
0.7205 times |
Weekly price and charts PlymouthIndustrial Strong weekly Stock price targets for PlymouthIndustrial PLYM are 21.77 and 21.94 | Weekly Target 1 | 21.73 | | Weekly Target 2 | 21.8 | | Weekly Target 3 | 21.9 | | Weekly Target 4 | 21.97 | | Weekly Target 5 | 22.07 |
Weekly price and volumes for Plymouth Industrial
| Date |
Closing |
Open |
Range |
Volume |
Fri 05 December 2025 |
21.87 (-0.32%) |
22.00 |
21.83 - 22.00 |
1.2851 times |
Fri 28 November 2025 |
21.94 (-1.3%) |
22.25 |
21.90 - 22.74 |
2.1199 times |
Fri 21 November 2025 |
22.23 (-0.36%) |
22.33 |
21.95 - 22.38 |
0.8316 times |
Fri 14 November 2025 |
22.31 (0.09%) |
22.26 |
22.07 - 22.31 |
0.6138 times |
Fri 07 November 2025 |
22.29 (1.32%) |
22.00 |
21.98 - 22.29 |
0.6004 times |
Fri 31 October 2025 |
22.00 (0%) |
21.96 |
21.93 - 22.07 |
0.2138 times |
Fri 31 October 2025 |
22.00 (-0.36%) |
21.82 |
21.79 - 22.07 |
3.0175 times |
Fri 24 October 2025 |
22.08 (-0.27%) |
22.15 |
21.91 - 22.24 |
0.3383 times |
Fri 17 October 2025 |
22.14 (0.68%) |
21.19 |
21.12 - 22.26 |
0.7049 times |
Tue 07 October 2025 |
21.99 (-0.63%) |
22.15 |
21.84 - 22.16 |
0.2746 times |
Fri 03 October 2025 |
22.13 (0.73%) |
21.93 |
21.78 - 22.60 |
0.4694 times |
Monthly price and charts PlymouthIndustrial Strong monthly Stock price targets for PlymouthIndustrial PLYM are 21.77 and 21.94 | Monthly Target 1 | 21.73 | | Monthly Target 2 | 21.8 | | Monthly Target 3 | 21.9 | | Monthly Target 4 | 21.97 | | Monthly Target 5 | 22.07 |
Monthly price and volumes Plymouth Industrial
| Date |
Closing |
Open |
Range |
Volume |
Fri 05 December 2025 |
21.87 (-0.32%) |
22.00 |
21.83 - 22.00 |
0.5383 times |
Fri 28 November 2025 |
21.94 (-0.27%) |
22.00 |
21.90 - 22.74 |
1.7451 times |
Fri 31 October 2025 |
22.00 (-1.48%) |
22.23 |
21.12 - 22.60 |
2.013 times |
Tue 30 September 2025 |
22.33 (1.5%) |
21.81 |
21.37 - 22.44 |
1.2391 times |
Fri 29 August 2025 |
22.00 (51.52%) |
14.54 |
14.05 - 22.65 |
1.8142 times |
Thu 31 July 2025 |
14.52 (-9.59%) |
15.97 |
14.45 - 16.55 |
0.5203 times |
Mon 30 June 2025 |
16.06 (-0.86%) |
16.11 |
15.66 - 17.04 |
0.5673 times |
Fri 30 May 2025 |
16.20 (8.94%) |
14.90 |
14.79 - 16.73 |
0.4673 times |
Wed 30 April 2025 |
14.87 (-8.77%) |
16.31 |
12.70 - 16.48 |
0.5541 times |
Mon 31 March 2025 |
16.30 (-6%) |
17.43 |
16.25 - 17.69 |
0.5413 times |
Fri 28 February 2025 |
17.34 (3.21%) |
16.61 |
16.06 - 17.38 |
0.4469 times |

DMA SMA EMA moving averages of Plymouth Industrial PLYM
DMA (daily moving average) of Plymouth Industrial PLYM
| DMA period | DMA value | | 5 day DMA | 21.93 | | 12 day DMA | 22.07 | | 20 day DMA | 22.13 | | 35 day DMA | 22.08 | | 50 day DMA | 22.04 | | 100 day DMA | 20.24 | | 150 day DMA | 18.85 | | 200 day DMA | 18.11 | EMA (exponential moving average) of Plymouth Industrial PLYM
| EMA period | EMA current | EMA prev | EMA prev2 | | 5 day EMA | 21.94 | 21.98 | 22.01 | | 12 day EMA | 22.02 | 22.05 | 22.07 | | 20 day EMA | 22.04 | 22.06 | 22.08 | | 35 day EMA | 22.06 | 22.07 | 22.08 | | 50 day EMA | 22.02 | 22.03 | 22.03 |
SMA (simple moving average) of Plymouth Industrial PLYM
| SMA period | SMA current | SMA prev | SMA prev2 | | 5 day SMA | 21.93 | 21.95 | 21.97 | | 12 day SMA | 22.07 | 22.11 | 22.13 | | 20 day SMA | 22.13 | 22.14 | 22.14 | | 35 day SMA | 22.08 | 22.08 | 22.09 | | 50 day SMA | 22.04 | 22.03 | 22.03 | | 100 day SMA | 20.24 | 20.18 | 20.12 | | 150 day SMA | 18.85 | 18.81 | 18.76 | | 200 day SMA | 18.11 | 18.08 | 18.05 |
|
|
