PackagingCorporation PKG full analysis,charts,indicators,moving averages,SMA,DMA,EMA,ADX,MACD,RSIPackaging Corporation PKG WideScreen charts, DMA,SMA,EMA technical analysis, forecast prediction, by indicators ADX,MACD,RSI,CCI NYSE stock exchange
operates under Consumer Durables sector & deals in Containers Packaging
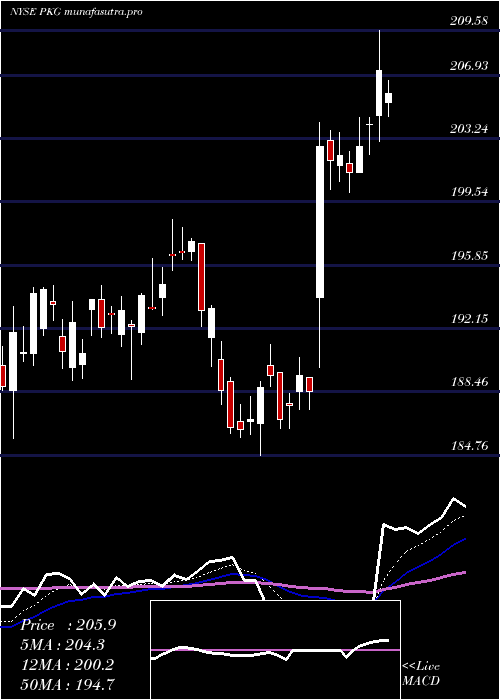
Daily price and charts and targets PackagingCorporation Strong Daily Stock price targets for PackagingCorporation PKG are 194.88 and 198.09 | Daily Target 1 | 194.29 | | Daily Target 2 | 195.46 | | Daily Target 3 | 197.5 | | Daily Target 4 | 198.67 | | Daily Target 5 | 200.71 |
Daily price and volume Packaging Corporation
| Date |
Closing |
Open |
Range |
Volume |
Thu 04 December 2025 |
196.63 (-0.67%) |
197.97 |
196.33 - 199.54 |
1.1084 times |
Wed 03 December 2025 |
197.95 (2.78%) |
193.26 |
192.66 - 198.41 |
1.4653 times |
Tue 02 December 2025 |
192.60 (-5.24%) |
203.80 |
191.65 - 203.99 |
0.9195 times |
Mon 01 December 2025 |
203.24 (-0.41%) |
203.49 |
202.88 - 205.45 |
0.8931 times |
Fri 28 November 2025 |
204.07 (0.29%) |
203.07 |
201.66 - 205.68 |
0.4426 times |
Wed 26 November 2025 |
203.49 (1.11%) |
200.68 |
200.63 - 204.37 |
0.7552 times |
Tue 25 November 2025 |
201.26 (2%) |
198.88 |
197.73 - 201.70 |
0.8259 times |
Mon 24 November 2025 |
197.32 (0.01%) |
196.35 |
195.62 - 198.16 |
1.1347 times |
Fri 21 November 2025 |
197.31 (2.94%) |
192.71 |
192.58 - 198.50 |
1.0708 times |
Thu 20 November 2025 |
191.68 (-1.35%) |
195.17 |
191.50 - 196.37 |
1.3845 times |
Wed 19 November 2025 |
194.31 (-1.18%) |
196.38 |
192.75 - 196.69 |
1.4226 times |
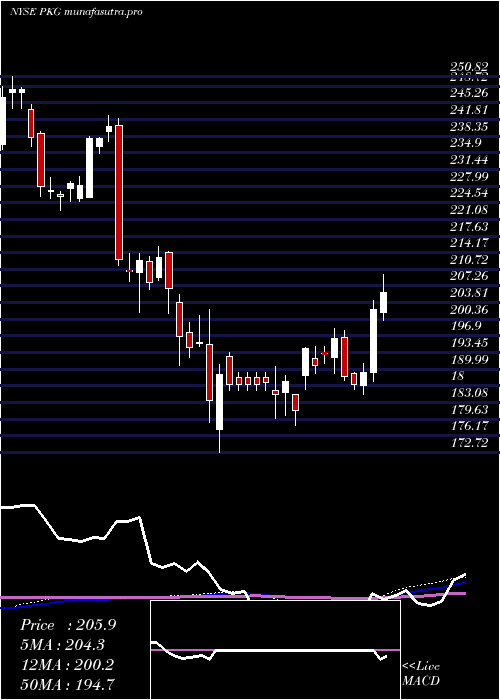
Weekly price and charts PackagingCorporation Strong weekly Stock price targets for PackagingCorporation PKG are 187.24 and 201.04 | Weekly Target 1 | 184.11 | | Weekly Target 2 | 190.37 | | Weekly Target 3 | 197.91 | | Weekly Target 4 | 204.17 | | Weekly Target 5 | 211.71 |
Weekly price and volumes for Packaging Corporation
| Date |
Closing |
Open |
Range |
Volume |
Thu 04 December 2025 |
196.63 (-3.65%) |
203.49 |
191.65 - 205.45 |
0.8977 times |
Fri 28 November 2025 |
204.07 (3.43%) |
196.35 |
195.62 - 205.68 |
0.6464 times |
Fri 21 November 2025 |
197.31 (0.05%) |
197.21 |
191.50 - 198.50 |
1.2596 times |
Fri 14 November 2025 |
197.22 (-1.66%) |
200.55 |
195.26 - 204.11 |
1.1322 times |
Fri 07 November 2025 |
200.55 (2.45%) |
195.16 |
194.68 - 200.83 |
1.1132 times |
Fri 31 October 2025 |
195.76 (0%) |
194.98 |
193.07 - 196.68 |
0.2587 times |
Fri 31 October 2025 |
195.76 (-4.43%) |
205.48 |
193.07 - 208.84 |
1.1954 times |
Fri 24 October 2025 |
204.83 (0.74%) |
203.97 |
198.27 - 215.77 |
1.6796 times |
Fri 17 October 2025 |
203.33 (-1.65%) |
208.67 |
202.37 - 212.30 |
0.9873 times |
Fri 10 October 2025 |
206.75 (-3.63%) |
214.08 |
206.58 - 215.15 |
0.8299 times |
Fri 03 October 2025 |
214.54 (-0.65%) |
216.59 |
213.04 - 218.56 |
0.7456 times |
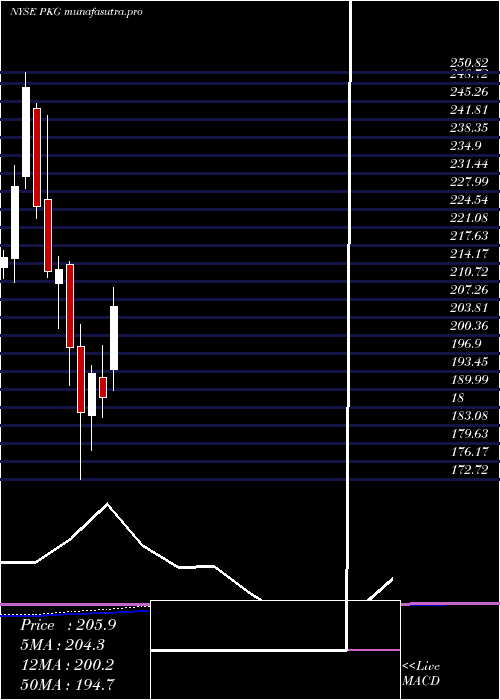
Monthly price and charts PackagingCorporation Strong monthly Stock price targets for PackagingCorporation PKG are 187.24 and 201.04 | Monthly Target 1 | 184.11 | | Monthly Target 2 | 190.37 | | Monthly Target 3 | 197.91 | | Monthly Target 4 | 204.17 | | Monthly Target 5 | 211.71 |
Monthly price and volumes Packaging Corporation
| Date |
Closing |
Open |
Range |
Volume |
Thu 04 December 2025 |
196.63 (-3.65%) |
203.49 |
191.65 - 205.45 |
0.1933 times |
Fri 28 November 2025 |
204.07 (4.24%) |
195.16 |
191.50 - 205.68 |
0.8937 times |
Fri 31 October 2025 |
195.76 (-10.17%) |
216.93 |
193.07 - 218.56 |
1.1531 times |
Tue 30 September 2025 |
217.93 (-0.01%) |
214.81 |
209.93 - 220.31 |
0.9186 times |
Fri 29 August 2025 |
217.96 (12.5%) |
192.47 |
189.03 - 219.37 |
1.1096 times |
Thu 31 July 2025 |
193.75 (2.81%) |
193.95 |
189.88 - 212.43 |
1.096 times |
Mon 30 June 2025 |
188.45 (-2.44%) |
192.38 |
184.76 - 198.53 |
0.9385 times |
Fri 30 May 2025 |
193.17 (4.07%) |
185.02 |
178.30 - 194.68 |
1.0953 times |
Wed 30 April 2025 |
185.61 (-6.27%) |
198.31 |
172.72 - 202.47 |
1.2859 times |
Mon 31 March 2025 |
198.02 (-7.07%) |
214.13 |
190.80 - 214.52 |
1.316 times |
Fri 28 February 2025 |
213.09 (0.2%) |
210.38 |
201.69 - 215.50 |
1.0806 times |
DMA SMA EMA moving averages of Packaging Corporation PKG
DMA (daily moving average) of Packaging Corporation PKG
| DMA period | DMA value | | 5 day DMA | 198.9 | | 12 day DMA | 198.04 | | 20 day DMA | 198.61 | | 35 day DMA | 200.43 | | 50 day DMA | 204.13 | | 100 day DMA | 205.35 | | 150 day DMA | 201.09 | | 200 day DMA | 199.63 | EMA (exponential moving average) of Packaging Corporation PKG
| EMA period | EMA current | EMA prev | EMA prev2 | | 5 day EMA | 197.88 | 198.51 | 198.79 | | 12 day EMA | 198.5 | 198.84 | 199 | | 20 day EMA | 199.19 | 199.46 | 199.62 | | 35 day EMA | 201.73 | 202.03 | 202.27 | | 50 day EMA | 204.35 | 204.66 | 204.93 |
SMA (simple moving average) of Packaging Corporation PKG
| SMA period | SMA current | SMA prev | SMA prev2 | | 5 day SMA | 198.9 | 200.27 | 200.93 | | 12 day SMA | 198.04 | 198.04 | 197.98 | | 20 day SMA | 198.61 | 198.74 | 198.7 | | 35 day SMA | 200.43 | 200.8 | 201.17 | | 50 day SMA | 204.13 | 204.5 | 204.82 | | 100 day SMA | 205.35 | 205.38 | 205.44 | | 150 day SMA | 201.09 | 201.02 | 200.94 | | 200 day SMA | 199.63 | 199.71 | 199.78 |
|
|
