PldtInc PHI full analysis,charts,indicators,moving averages,SMA,DMA,EMA,ADX,MACD,RSIPldt Inc PHI WideScreen charts, DMA,SMA,EMA technical analysis, forecast prediction, by indicators ADX,MACD,RSI,CCI NYSE stock exchange
operates under Public Utilities sector & deals in Telecommunications Equipment
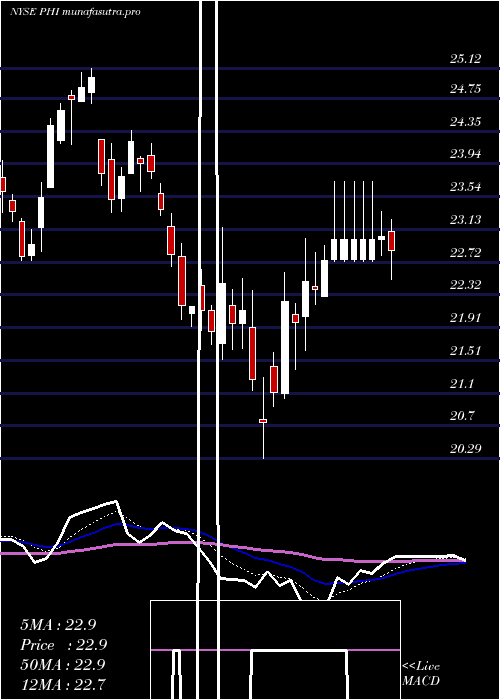
Daily price and charts and targets PldtInc Strong Daily Stock price targets for PldtInc PHI are 21.77 and 22.05 | Daily Target 1 | 21.57 | | Daily Target 2 | 21.69 | | Daily Target 3 | 21.846666666667 | | Daily Target 4 | 21.97 | | Daily Target 5 | 22.13 |
Daily price and volume Pldt Inc
| Date |
Closing |
Open |
Range |
Volume |
Fri 05 December 2025 |
21.82 (-0.05%) |
21.80 |
21.72 - 22.00 |
0.536 times |
Thu 04 December 2025 |
21.83 (-0.32%) |
21.83 |
21.80 - 21.95 |
0.8262 times |
Wed 03 December 2025 |
21.90 (-0.59%) |
22.09 |
21.78 - 22.12 |
0.7137 times |
Tue 02 December 2025 |
22.03 (0.14%) |
22.04 |
21.80 - 22.15 |
0.8026 times |
Mon 01 December 2025 |
22.00 (-1.52%) |
22.10 |
21.97 - 22.20 |
1.3997 times |
Fri 28 November 2025 |
22.34 (-0.22%) |
22.45 |
22.07 - 22.45 |
0.6165 times |
Wed 26 November 2025 |
22.39 (-0.18%) |
22.35 |
22.17 - 22.47 |
1.1955 times |
Tue 25 November 2025 |
22.43 (-0.04%) |
22.39 |
22.20 - 22.59 |
1.3358 times |
Mon 24 November 2025 |
22.44 (-0.04%) |
22.38 |
22.22 - 22.59 |
1.3941 times |
Fri 21 November 2025 |
22.45 (2.18%) |
21.90 |
21.90 - 22.59 |
1.1799 times |
Thu 20 November 2025 |
21.97 (-0.05%) |
21.93 |
21.81 - 22.00 |
0.8845 times |
Weekly price and charts PldtInc Strong weekly Stock price targets for PldtInc PHI are 21.53 and 22.01 | Weekly Target 1 | 21.43 | | Weekly Target 2 | 21.63 | | Weekly Target 3 | 21.913333333333 | | Weekly Target 4 | 22.11 | | Weekly Target 5 | 22.39 |
Weekly price and volumes for Pldt Inc
| Date |
Closing |
Open |
Range |
Volume |
Fri 05 December 2025 |
21.82 (-2.33%) |
22.10 |
21.72 - 22.20 |
0.7077 times |
Fri 28 November 2025 |
22.34 (-0.49%) |
22.38 |
22.07 - 22.59 |
0.7513 times |
Fri 21 November 2025 |
22.45 (7.57%) |
21.00 |
21.00 - 22.59 |
0.9973 times |
Fri 14 November 2025 |
20.87 (8.36%) |
19.25 |
19.11 - 21.17 |
1.3607 times |
Fri 07 November 2025 |
19.26 (-0.62%) |
19.25 |
19.02 - 19.69 |
1.3343 times |
Fri 31 October 2025 |
19.38 (0%) |
18.96 |
18.90 - 19.45 |
0.3099 times |
Fri 31 October 2025 |
19.38 (1.79%) |
19.08 |
18.67 - 19.45 |
1.581 times |
Fri 24 October 2025 |
19.04 (0.42%) |
19.05 |
18.80 - 19.50 |
1.0502 times |
Fri 17 October 2025 |
18.96 (-0.32%) |
19.00 |
18.66 - 19.13 |
1.4227 times |
Tue 07 October 2025 |
19.02 (0.11%) |
19.00 |
18.69 - 19.24 |
0.485 times |
Fri 03 October 2025 |
19.00 (-0.21%) |
19.05 |
18.61 - 19.08 |
1.3663 times |

Monthly price and charts PldtInc Strong monthly Stock price targets for PldtInc PHI are 21.53 and 22.01 | Monthly Target 1 | 21.43 | | Monthly Target 2 | 21.63 | | Monthly Target 3 | 21.913333333333 | | Monthly Target 4 | 22.11 | | Monthly Target 5 | 22.39 |
Monthly price and volumes Pldt Inc
| Date |
Closing |
Open |
Range |
Volume |
Fri 05 December 2025 |
21.82 (-2.33%) |
22.10 |
21.72 - 22.20 |
0.18 times |
Fri 28 November 2025 |
22.34 (15.27%) |
19.25 |
19.02 - 22.59 |
1.1305 times |
Fri 31 October 2025 |
19.38 (3.64%) |
18.80 |
18.66 - 19.50 |
1.4524 times |
Tue 30 September 2025 |
18.70 (-8.69%) |
20.39 |
18.61 - 20.39 |
1.8069 times |
Fri 29 August 2025 |
20.48 (-11.27%) |
23.20 |
20.22 - 23.46 |
1.0926 times |
Thu 31 July 2025 |
23.08 (6.07%) |
21.69 |
21.51 - 23.43 |
0.8309 times |
Mon 30 June 2025 |
21.76 (-2.94%) |
22.42 |
21.02 - 23.03 |
0.8247 times |
Fri 30 May 2025 |
22.42 (-4.47%) |
23.50 |
21.97 - 24.09 |
0.694 times |
Wed 30 April 2025 |
23.47 (7.32%) |
21.71 |
20.29 - 23.72 |
1.0911 times |
Mon 31 March 2025 |
21.87 (-4.08%) |
22.81 |
21.70 - 25.12 |
0.897 times |
Fri 28 February 2025 |
22.80 (0.48%) |
22.69 |
22.50 - 24.10 |
0.6352 times |

DMA SMA EMA moving averages of Pldt Inc PHI
DMA (daily moving average) of Pldt Inc PHI
| DMA period | DMA value | | 5 day DMA | 21.92 | | 12 day DMA | 22.13 | | 20 day DMA | 21.53 | | 35 day DMA | 20.52 | | 50 day DMA | 20.06 | | 100 day DMA | 20.83 | | 150 day DMA | 21.4 | | 200 day DMA | 21.83 | EMA (exponential moving average) of Pldt Inc PHI
| EMA period | EMA current | EMA prev | EMA prev2 | | 5 day EMA | 21.93 | 21.98 | 22.06 | | 12 day EMA | 21.85 | 21.85 | 21.85 | | 20 day EMA | 21.49 | 21.45 | 21.41 | | 35 day EMA | 20.91 | 20.86 | 20.8 | | 50 day EMA | 20.2 | 20.13 | 20.06 |
SMA (simple moving average) of Pldt Inc PHI
| SMA period | SMA current | SMA prev | SMA prev2 | | 5 day SMA | 21.92 | 22.02 | 22.13 | | 12 day SMA | 22.13 | 22.14 | 22.13 | | 20 day SMA | 21.53 | 21.4 | 21.29 | | 35 day SMA | 20.52 | 20.44 | 20.36 | | 50 day SMA | 20.06 | 20.01 | 19.96 | | 100 day SMA | 20.83 | 20.83 | 20.83 | | 150 day SMA | 21.4 | 21.41 | 21.42 | | 200 day SMA | 21.83 | 21.84 | 21.85 |
|
|
