PrincipalReal PGZ full analysis,charts,indicators,moving averages,SMA,DMA,EMA,ADX,MACD,RSIPrincipal Real PGZ WideScreen charts, DMA,SMA,EMA technical analysis, forecast prediction, by indicators ADX,MACD,RSI,CCI NYSE stock exchange
operates under N A sector & deals in N A
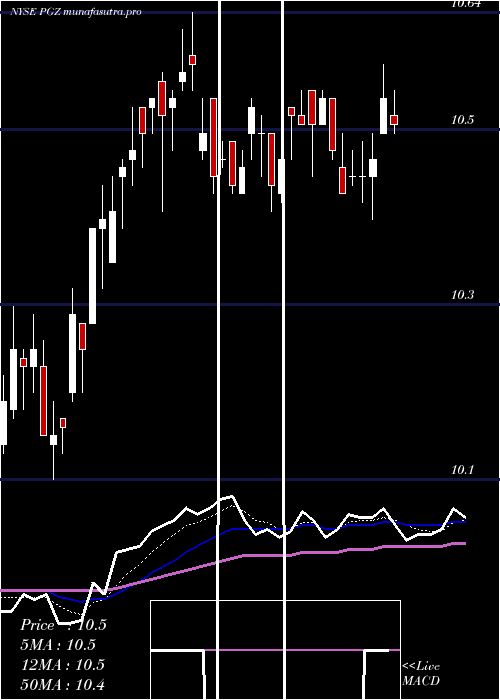
Daily price and charts and targets PrincipalReal Strong Daily Stock price targets for PrincipalReal PGZ are 10.08 and 10.13 | Daily Target 1 | 10.07 | | Daily Target 2 | 10.09 | | Daily Target 3 | 10.12 | | Daily Target 4 | 10.14 | | Daily Target 5 | 10.17 |
Daily price and volume Principal Real
| Date |
Closing |
Open |
Range |
Volume |
Fri 05 December 2025 |
10.11 (0%) |
10.13 |
10.10 - 10.15 |
0.4691 times |
Thu 04 December 2025 |
10.11 (-0.1%) |
10.15 |
10.11 - 10.16 |
0.522 times |
Wed 03 December 2025 |
10.12 (0%) |
10.15 |
10.07 - 10.15 |
0.7235 times |
Tue 02 December 2025 |
10.12 (0.1%) |
10.11 |
10.10 - 10.15 |
0.6574 times |
Mon 01 December 2025 |
10.11 (-0.69%) |
10.17 |
10.02 - 10.23 |
1.1926 times |
Fri 28 November 2025 |
10.18 (0.1%) |
10.18 |
10.14 - 10.21 |
1.4371 times |
Wed 26 November 2025 |
10.17 (0.2%) |
10.12 |
10.08 - 10.18 |
1.0307 times |
Tue 25 November 2025 |
10.15 (0.59%) |
10.10 |
10.10 - 10.16 |
1.1761 times |
Mon 24 November 2025 |
10.09 (-0.69%) |
10.18 |
10.06 - 10.23 |
2.3456 times |
Fri 21 November 2025 |
10.16 (0.69%) |
10.12 |
10.09 - 10.19 |
0.446 times |
Thu 20 November 2025 |
10.09 (0.1%) |
10.15 |
10.06 - 10.15 |
0.3601 times |
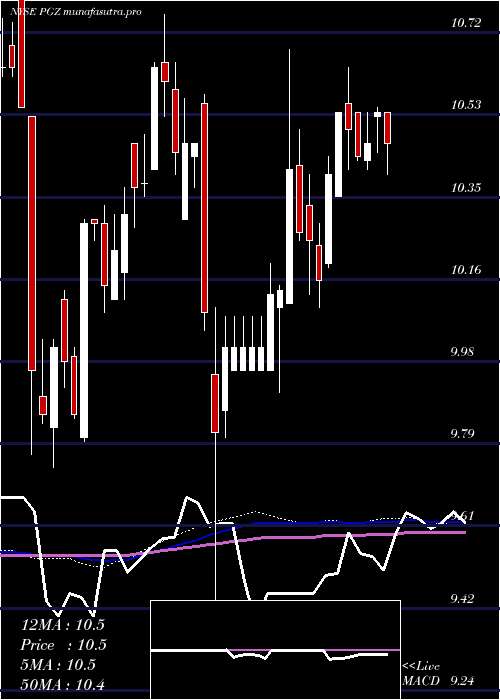
Weekly price and charts PrincipalReal Strong weekly Stock price targets for PrincipalReal PGZ are 9.96 and 10.17 | Weekly Target 1 | 9.91 | | Weekly Target 2 | 10.01 | | Weekly Target 3 | 10.12 | | Weekly Target 4 | 10.22 | | Weekly Target 5 | 10.33 |
Weekly price and volumes for Principal Real
| Date |
Closing |
Open |
Range |
Volume |
Fri 05 December 2025 |
10.11 (-0.69%) |
10.17 |
10.02 - 10.23 |
0.7585 times |
Fri 28 November 2025 |
10.18 (0.2%) |
10.18 |
10.06 - 10.23 |
1.2744 times |
Fri 21 November 2025 |
10.16 (-1.36%) |
10.30 |
10.04 - 10.30 |
0.7409 times |
Fri 14 November 2025 |
10.30 (0.29%) |
10.35 |
10.25 - 10.43 |
0.9349 times |
Fri 07 November 2025 |
10.27 (-1.15%) |
10.39 |
10.19 - 10.55 |
1.2287 times |
Fri 31 October 2025 |
10.39 (0%) |
10.43 |
10.36 - 10.48 |
0.2334 times |
Fri 31 October 2025 |
10.39 (-0.19%) |
10.44 |
10.30 - 10.48 |
1.0959 times |
Fri 24 October 2025 |
10.41 (0.19%) |
10.45 |
10.36 - 10.49 |
1.997 times |
Fri 17 October 2025 |
10.39 (-0.1%) |
10.40 |
10.29 - 10.54 |
1.3911 times |
Tue 07 October 2025 |
10.40 (-0.76%) |
10.49 |
10.35 - 10.50 |
0.3452 times |
Fri 03 October 2025 |
10.48 (0.67%) |
10.47 |
10.41 - 10.60 |
0.9758 times |
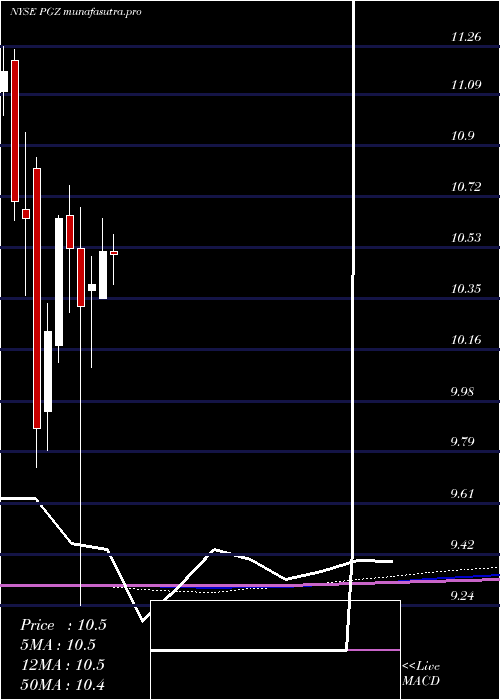
Monthly price and charts PrincipalReal Strong monthly Stock price targets for PrincipalReal PGZ are 9.96 and 10.17 | Monthly Target 1 | 9.91 | | Monthly Target 2 | 10.01 | | Monthly Target 3 | 10.12 | | Monthly Target 4 | 10.22 | | Monthly Target 5 | 10.33 |
Monthly price and volumes Principal Real
| Date |
Closing |
Open |
Range |
Volume |
Fri 05 December 2025 |
10.11 (-0.69%) |
10.17 |
10.02 - 10.23 |
0.2075 times |
Fri 28 November 2025 |
10.18 (-2.02%) |
10.39 |
10.04 - 10.55 |
1.1435 times |
Fri 31 October 2025 |
10.39 (-0.67%) |
10.50 |
10.29 - 10.60 |
1.5602 times |
Tue 30 September 2025 |
10.46 (-0.48%) |
10.50 |
10.35 - 10.64 |
1.1701 times |
Fri 29 August 2025 |
10.51 (1.25%) |
10.40 |
10.29 - 10.60 |
1.3255 times |
Thu 31 July 2025 |
10.38 (-1.33%) |
10.52 |
10.27 - 10.58 |
0.9757 times |
Mon 30 June 2025 |
10.52 (1.15%) |
10.35 |
10.35 - 10.64 |
0.712 times |
Fri 30 May 2025 |
10.40 (0.78%) |
10.38 |
10.10 - 10.50 |
0.8693 times |
Wed 30 April 2025 |
10.32 (-1.99%) |
10.53 |
9.24 - 10.68 |
1.13 times |
Mon 31 March 2025 |
10.53 (-1.03%) |
10.65 |
10.30 - 10.76 |
0.9061 times |
Fri 28 February 2025 |
10.64 (4.01%) |
10.18 |
10.12 - 10.65 |
1.0972 times |
DMA SMA EMA moving averages of Principal Real PGZ
DMA (daily moving average) of Principal Real PGZ
| DMA period | DMA value | | 5 day DMA | 10.11 | | 12 day DMA | 10.12 | | 20 day DMA | 10.19 | | 35 day DMA | 10.28 | | 50 day DMA | 10.33 | | 100 day DMA | 10.4 | | 150 day DMA | 10.4 | | 200 day DMA | 10.37 | EMA (exponential moving average) of Principal Real PGZ
| EMA period | EMA current | EMA prev | EMA prev2 | | 5 day EMA | 10.12 | 10.12 | 10.13 | | 12 day EMA | 10.15 | 10.16 | 10.17 | | 20 day EMA | 10.19 | 10.2 | 10.21 | | 35 day EMA | 10.24 | 10.25 | 10.26 | | 50 day EMA | 10.31 | 10.32 | 10.33 |
SMA (simple moving average) of Principal Real PGZ
| SMA period | SMA current | SMA prev | SMA prev2 | | 5 day SMA | 10.11 | 10.13 | 10.14 | | 12 day SMA | 10.12 | 10.13 | 10.13 | | 20 day SMA | 10.19 | 10.2 | 10.21 | | 35 day SMA | 10.28 | 10.29 | 10.3 | | 50 day SMA | 10.33 | 10.33 | 10.34 | | 100 day SMA | 10.4 | 10.4 | 10.4 | | 150 day SMA | 10.4 | 10.4 | 10.4 | | 200 day SMA | 10.37 | 10.37 | 10.38 |
|
|
