ProgressiveCorporation PGR full analysis,charts,indicators,moving averages,SMA,DMA,EMA,ADX,MACD,RSIProgressive Corporation PGR WideScreen charts, DMA,SMA,EMA technical analysis, forecast prediction, by indicators ADX,MACD,RSI,CCI NYSE stock exchange
operates under Finance sector & deals in Property Casualty Insurers
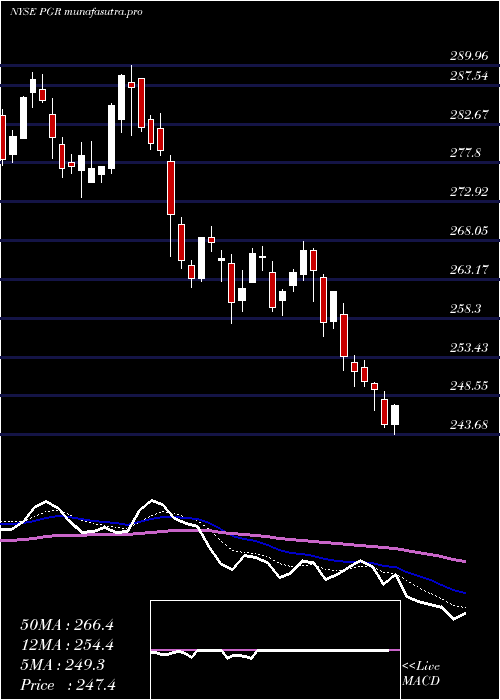
Daily price and charts and targets ProgressiveCorporation Strong Daily Stock price targets for ProgressiveCorporation PGR are 226 and 227.96 | Daily Target 1 | 225.63 | | Daily Target 2 | 226.36 | | Daily Target 3 | 227.59 | | Daily Target 4 | 228.32 | | Daily Target 5 | 229.55 |
Daily price and volume Progressive Corporation
| Date |
Closing |
Open |
Range |
Volume |
Thu 04 December 2025 |
227.09 (-0.04%) |
227.63 |
226.86 - 228.82 |
0.6426 times |
Wed 03 December 2025 |
227.18 (-0.69%) |
228.72 |
226.03 - 229.56 |
0.9601 times |
Tue 02 December 2025 |
228.76 (0.41%) |
226.91 |
225.04 - 229.31 |
1.2817 times |
Mon 01 December 2025 |
227.82 (-0.42%) |
229.00 |
227.63 - 231.91 |
1.1266 times |
Fri 28 November 2025 |
228.79 (-0.16%) |
228.48 |
227.96 - 230.10 |
0.4052 times |
Wed 26 November 2025 |
229.15 (1.21%) |
226.56 |
225.89 - 229.84 |
0.9155 times |
Tue 25 November 2025 |
226.41 (0.59%) |
226.91 |
225.84 - 228.50 |
0.7655 times |
Mon 24 November 2025 |
225.08 (-0.81%) |
227.33 |
224.83 - 227.98 |
1.8959 times |
Fri 21 November 2025 |
226.91 (0.4%) |
228.29 |
225.67 - 229.92 |
1.104 times |
Thu 20 November 2025 |
226.00 (1.38%) |
223.24 |
220.80 - 226.20 |
0.9028 times |
Wed 19 November 2025 |
222.93 (-0.87%) |
226.52 |
222.13 - 229.49 |
1.2364 times |
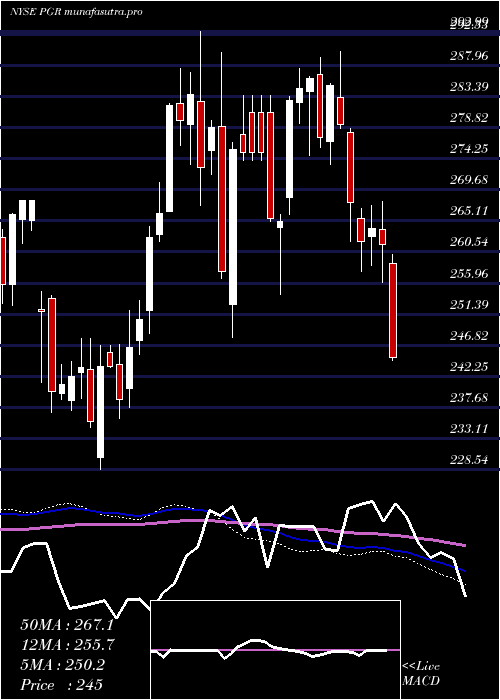
Weekly price and charts ProgressiveCorporation Strong weekly Stock price targets for ProgressiveCorporation PGR are 222.63 and 229.5 | Weekly Target 1 | 221.14 | | Weekly Target 2 | 224.12 | | Weekly Target 3 | 228.01333333333 | | Weekly Target 4 | 230.99 | | Weekly Target 5 | 234.88 |
Weekly price and volumes for Progressive Corporation
| Date |
Closing |
Open |
Range |
Volume |
Thu 04 December 2025 |
227.09 (-0.74%) |
229.00 |
225.04 - 231.91 |
0.8651 times |
Fri 28 November 2025 |
228.79 (0.83%) |
227.33 |
224.83 - 230.10 |
0.8588 times |
Fri 21 November 2025 |
226.91 (0.77%) |
227.30 |
220.80 - 229.92 |
1.1892 times |
Fri 14 November 2025 |
225.18 (3.63%) |
215.00 |
213.71 - 227.05 |
1.0033 times |
Fri 07 November 2025 |
217.30 (5.49%) |
202.99 |
202.60 - 217.43 |
0.8648 times |
Fri 31 October 2025 |
206.00 (0%) |
205.76 |
205.55 - 207.55 |
0.2781 times |
Fri 31 October 2025 |
206.00 (-5.97%) |
219.66 |
205.55 - 220.00 |
1.6079 times |
Fri 24 October 2025 |
219.09 (-2.89%) |
222.89 |
217.45 - 224.82 |
1.0463 times |
Fri 17 October 2025 |
225.61 (-7.5%) |
237.93 |
217.20 - 241.01 |
1.8693 times |
Tue 07 October 2025 |
243.89 (-0.74%) |
245.40 |
239.16 - 245.40 |
0.4171 times |
Fri 03 October 2025 |
245.70 (0.91%) |
244.52 |
241.86 - 248.17 |
0.8111 times |
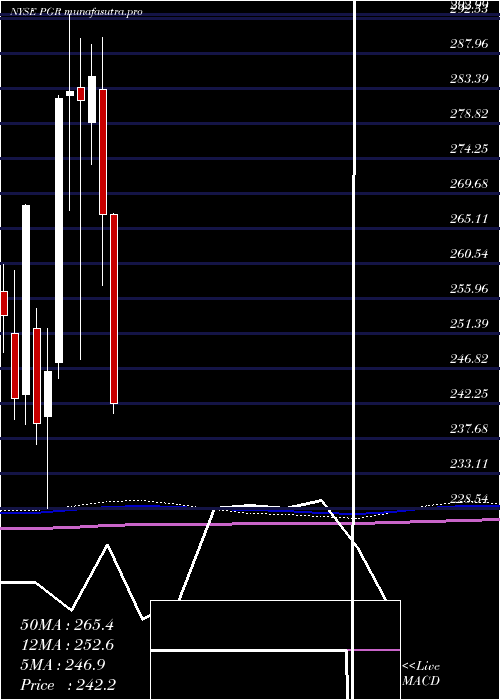
Monthly price and charts ProgressiveCorporation Strong monthly Stock price targets for ProgressiveCorporation PGR are 222.63 and 229.5 | Monthly Target 1 | 221.14 | | Monthly Target 2 | 224.12 | | Monthly Target 3 | 228.01333333333 | | Monthly Target 4 | 230.99 | | Monthly Target 5 | 234.88 |
Monthly price and volumes Progressive Corporation
| Date |
Closing |
Open |
Range |
Volume |
Thu 04 December 2025 |
227.09 (-0.74%) |
229.00 |
225.04 - 231.91 |
0.199 times |
Fri 28 November 2025 |
228.79 (11.06%) |
202.99 |
202.60 - 230.10 |
0.9007 times |
Fri 31 October 2025 |
206.00 (-16.58%) |
245.84 |
205.55 - 248.17 |
1.3015 times |
Tue 30 September 2025 |
246.95 (-0.04%) |
247.91 |
236.75 - 249.83 |
0.932 times |
Fri 29 August 2025 |
247.06 (2.07%) |
243.32 |
239.59 - 254.93 |
0.9559 times |
Thu 31 July 2025 |
242.04 (-9.3%) |
266.86 |
239.11 - 267.00 |
1.3554 times |
Mon 30 June 2025 |
266.86 (-6.34%) |
283.22 |
257.61 - 289.96 |
1.2385 times |
Fri 30 May 2025 |
284.93 (1.13%) |
278.86 |
273.42 - 289.10 |
0.8942 times |
Wed 30 April 2025 |
281.74 (-0.45%) |
283.51 |
247.98 - 289.88 |
1.1163 times |
Mon 31 March 2025 |
283.01 (0.36%) |
282.38 |
267.39 - 292.99 |
1.1064 times |
Fri 28 February 2025 |
282.00 (14.43%) |
247.52 |
245.51 - 282.40 |
0.7752 times |
DMA SMA EMA moving averages of Progressive Corporation PGR
DMA (daily moving average) of Progressive Corporation PGR
| DMA period | DMA value | | 5 day DMA | 227.93 | | 12 day DMA | 226.75 | | 20 day DMA | 224.05 | | 35 day DMA | 220.16 | | 50 day DMA | 226.51 | | 100 day DMA | 236.23 | | 150 day DMA | 248.55 | | 200 day DMA | 254.95 | EMA (exponential moving average) of Progressive Corporation PGR
| EMA period | EMA current | EMA prev | EMA prev2 | | 5 day EMA | 227.49 | 227.69 | 227.95 | | 12 day EMA | 226.24 | 226.09 | 225.89 | | 20 day EMA | 225.01 | 224.79 | 224.54 | | 35 day EMA | 226.87 | 226.86 | 226.84 | | 50 day EMA | 228.06 | 228.1 | 228.14 |
SMA (simple moving average) of Progressive Corporation PGR
| SMA period | SMA current | SMA prev | SMA prev2 | | 5 day SMA | 227.93 | 228.34 | 228.19 | | 12 day SMA | 226.75 | 226.61 | 226.44 | | 20 day SMA | 224.05 | 223.14 | 222.26 | | 35 day SMA | 220.16 | 220.14 | 220.52 | | 50 day SMA | 226.51 | 226.82 | 227.11 | | 100 day SMA | 236.23 | 236.45 | 236.68 | | 150 day SMA | 248.55 | 248.8 | 249.06 | | 200 day SMA | 254.95 | 255.09 | 255.25 |
|
|
