ProcterGamble PG full analysis,charts,indicators,moving averages,SMA,DMA,EMA,ADX,MACD,RSIProcter Gamble PG WideScreen charts, DMA,SMA,EMA technical analysis, forecast prediction, by indicators ADX,MACD,RSI,CCI NYSE stock exchange
operates under Basic Industries sector & deals in Package Goods Cosmetics
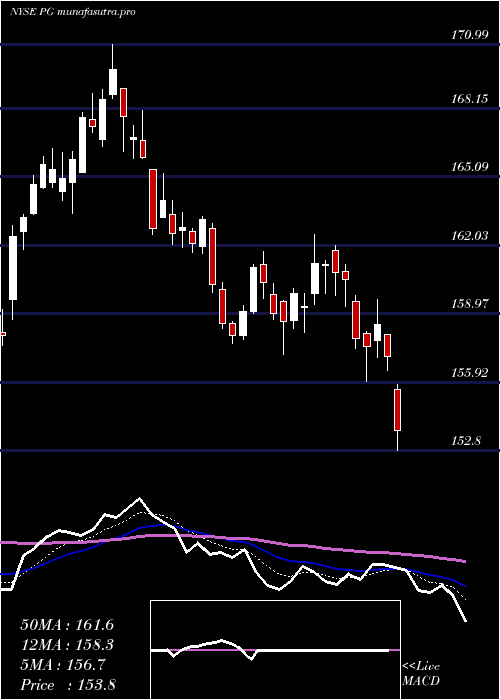
Daily price and charts and targets ProcterGamble Strong Daily Stock price targets for ProcterGamble PG are 150.54 and 151.95 | Daily Target 1 | 150.18 | | Daily Target 2 | 150.9 | | Daily Target 3 | 151.59 | | Daily Target 4 | 152.31 | | Daily Target 5 | 153 |
Daily price and volume Procter Gamble
| Date |
Closing |
Open |
Range |
Volume |
Tue 21 October 2025 |
151.62 (-0.22%) |
151.96 |
150.87 - 152.28 |
0.8541 times |
Mon 20 October 2025 |
151.96 (0.37%) |
151.59 |
151.30 - 152.39 |
0.7956 times |
Fri 17 October 2025 |
151.40 (1.2%) |
150.57 |
150.43 - 152.03 |
1.2233 times |
Thu 16 October 2025 |
149.60 (1.48%) |
148.01 |
147.92 - 150.40 |
1.2513 times |
Wed 15 October 2025 |
147.42 (-1.17%) |
148.52 |
147.27 - 149.41 |
1.4209 times |
Tue 14 October 2025 |
149.16 (1.13%) |
147.57 |
147.08 - 149.25 |
1.2195 times |
Mon 13 October 2025 |
147.49 (-3.31%) |
149.00 |
146.97 - 149.43 |
1.0669 times |
Tue 07 October 2025 |
152.54 (1.31%) |
150.76 |
150.05 - 153.17 |
0.9722 times |
Mon 06 October 2025 |
150.57 (-1.27%) |
152.49 |
150.40 - 152.73 |
0.6308 times |
Fri 03 October 2025 |
152.50 (0.3%) |
152.26 |
151.92 - 153.43 |
0.5654 times |
Thu 02 October 2025 |
152.05 (-0.74%) |
152.82 |
151.63 - 153.23 |
0.7623 times |
Weekly price and charts ProcterGamble Strong weekly Stock price targets for ProcterGamble PG are 151.25 and 152.77 | Weekly Target 1 | 150.11 | | Weekly Target 2 | 150.86 | | Weekly Target 3 | 151.62666666667 | | Weekly Target 4 | 152.38 | | Weekly Target 5 | 153.15 |
Weekly price and volumes for Procter Gamble
| Date |
Closing |
Open |
Range |
Volume |
Tue 21 October 2025 |
151.62 (0.15%) |
151.59 |
150.87 - 152.39 |
0.4312 times |
Fri 17 October 2025 |
151.40 (-0.75%) |
149.00 |
146.97 - 152.03 |
1.6159 times |
Tue 07 October 2025 |
152.54 (0.03%) |
152.49 |
150.05 - 153.17 |
0.419 times |
Fri 03 October 2025 |
152.50 (0%) |
152.42 |
151.41 - 154.38 |
1.2184 times |
Fri 26 September 2025 |
152.50 (-2.27%) |
156.08 |
150.97 - 156.08 |
1.3842 times |
Fri 19 September 2025 |
156.04 (-1.18%) |
157.88 |
155.97 - 161.67 |
1.6409 times |
Fri 12 September 2025 |
157.90 (-1.32%) |
159.61 |
155.89 - 160.27 |
1.1193 times |
Fri 05 September 2025 |
160.02 (1.9%) |
157.36 |
156.50 - 160.56 |
0.9801 times |
Fri 29 August 2025 |
157.04 (0%) |
156.09 |
155.65 - 157.55 |
0.1975 times |
Fri 29 August 2025 |
157.04 (-1.03%) |
158.39 |
155.03 - 158.70 |
0.9935 times |
Fri 22 August 2025 |
158.67 (2.79%) |
154.42 |
154.17 - 161.03 |
1.344 times |
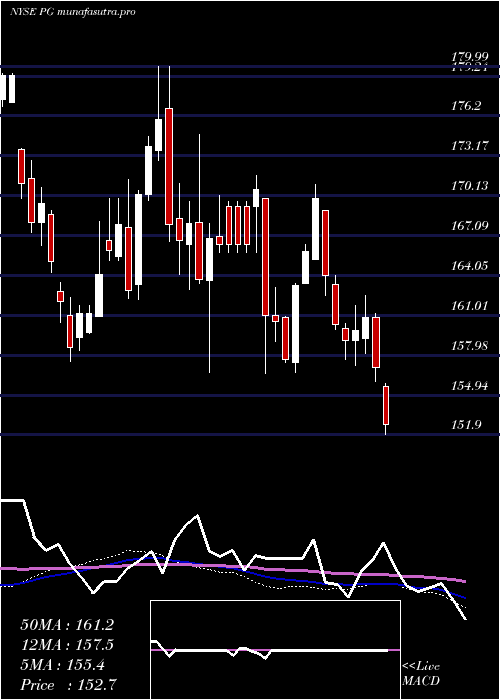
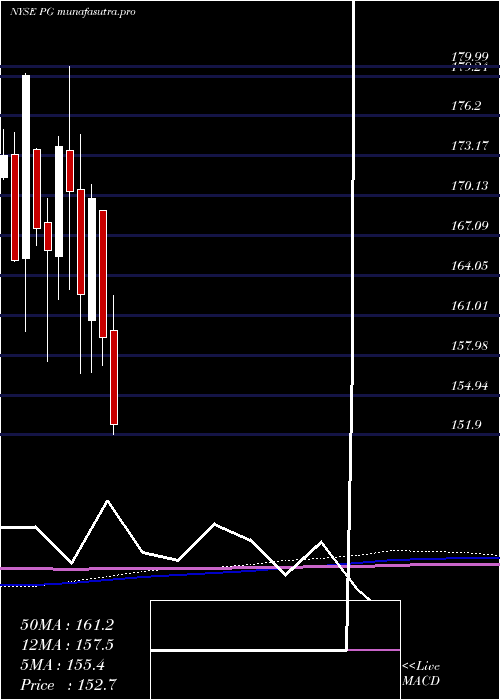
Monthly price and charts ProcterGamble Strong monthly Stock price targets for ProcterGamble PG are 145.84 and 152.76 | Monthly Target 1 | 143.91 | | Monthly Target 2 | 147.76 | | Monthly Target 3 | 150.82666666667 | | Monthly Target 4 | 154.68 | | Monthly Target 5 | 157.75 |
Monthly price and volumes Procter Gamble
| Date |
Closing |
Open |
Range |
Volume |
Tue 21 October 2025 |
151.62 (-1.32%) |
153.70 |
146.97 - 153.89 |
0.5422 times |
Tue 30 September 2025 |
153.65 (-2.16%) |
157.36 |
150.97 - 161.67 |
1.0015 times |
Fri 29 August 2025 |
157.04 (4.37%) |
151.77 |
150.21 - 161.03 |
0.8914 times |
Thu 31 July 2025 |
150.47 (-5.55%) |
159.88 |
149.91 - 162.53 |
1.2751 times |
Mon 30 June 2025 |
159.32 (-6.22%) |
169.02 |
157.17 - 169.04 |
1.0126 times |
Fri 30 May 2025 |
169.89 (4.5%) |
160.65 |
156.69 - 170.99 |
0.979 times |
Wed 30 April 2025 |
162.57 (-4.61%) |
170.57 |
156.58 - 174.80 |
1.2673 times |
Mon 31 March 2025 |
170.42 (-1.97%) |
173.58 |
162.99 - 179.99 |
1.0922 times |
Fri 28 February 2025 |
173.84 (4.73%) |
165.47 |
162.20 - 174.65 |
0.8994 times |
Fri 31 January 2025 |
165.99 (-0.99%) |
168.09 |
157.47 - 169.94 |
1.0391 times |
Tue 31 December 2024 |
167.65 (-6.5%) |
173.63 |
166.36 - 173.76 |
0.65 times |
DMA SMA EMA moving averages of Procter Gamble PG
DMA (daily moving average) of Procter Gamble PG
| DMA period | DMA value | | 5 day DMA | 150.4 | | 12 day DMA | 150.79 | | 20 day DMA | 151.77 | | 35 day DMA | 154.56 | | 50 day DMA | 155.05 | | 100 day DMA | 157.23 | | 150 day DMA | 159.66 | | 200 day DMA | 161.56 | EMA (exponential moving average) of Procter Gamble PG
| EMA period | EMA current | EMA prev | EMA prev2 | | 5 day EMA | 150.99 | 150.67 | 150.03 | | 12 day EMA | 151.19 | 151.11 | 150.95 | | 20 day EMA | 152.02 | 152.06 | 152.07 | | 35 day EMA | 152.99 | 153.07 | 153.14 | | 50 day EMA | 154.32 | 154.43 | 154.53 |
SMA (simple moving average) of Procter Gamble PG
| SMA period | SMA current | SMA prev | SMA prev2 | | 5 day SMA | 150.4 | 149.91 | 149.01 | | 12 day SMA | 150.79 | 150.96 | 151.09 | | 20 day SMA | 151.77 | 152.05 | 152.47 | | 35 day SMA | 154.56 | 154.68 | 154.82 | | 50 day SMA | 155.05 | 155.09 | 155.11 | | 100 day SMA | 157.23 | 157.36 | 157.5 | | 150 day SMA | 159.66 | 159.77 | 159.88 | | 200 day SMA | 161.56 | 161.64 | 161.71 |
|
|
