ProvidentFinancial PFS full analysis,charts,indicators,moving averages,SMA,DMA,EMA,ADX,MACD,RSIProvident Financial PFS WideScreen charts, DMA,SMA,EMA technical analysis, forecast prediction, by indicators ADX,MACD,RSI,CCI NYSE stock exchange
operates under Finance sector & deals in Savings Institutions
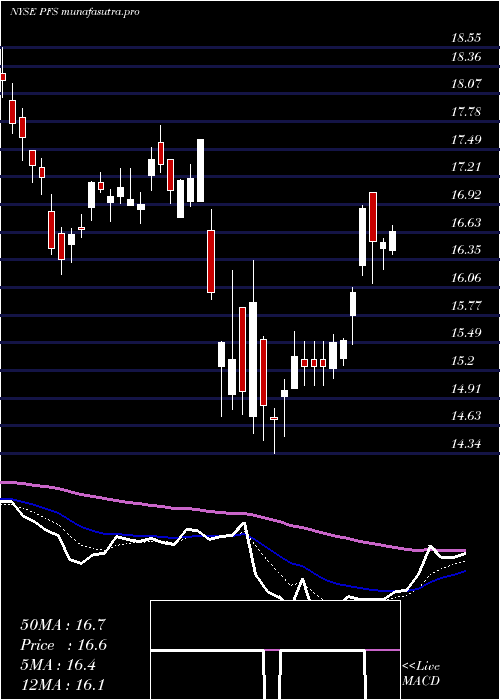
Daily price and charts and targets ProvidentFinancial Strong Daily Stock price targets for ProvidentFinancial PFS are 19.97 and 20.2 | Daily Target 1 | 19.79 | | Daily Target 2 | 19.91 | | Daily Target 3 | 20.02 | | Daily Target 4 | 20.14 | | Daily Target 5 | 20.25 |
Daily price and volume Provident Financial
| Date |
Closing |
Open |
Range |
Volume |
Thu 04 December 2025 |
20.03 (0.35%) |
19.97 |
19.90 - 20.13 |
0.4638 times |
Wed 03 December 2025 |
19.96 (2.52%) |
19.51 |
19.51 - 19.96 |
0.662 times |
Tue 02 December 2025 |
19.47 (0.21%) |
19.57 |
19.35 - 19.60 |
1.2733 times |
Mon 01 December 2025 |
19.43 (1.3%) |
19.13 |
19.11 - 19.48 |
0.7149 times |
Fri 28 November 2025 |
19.18 (-0.36%) |
19.25 |
19.09 - 19.38 |
0.5512 times |
Wed 26 November 2025 |
19.25 (-1.03%) |
19.38 |
19.25 - 19.52 |
1.4376 times |
Tue 25 November 2025 |
19.45 (3.51%) |
18.99 |
18.84 - 19.66 |
1.6165 times |
Mon 24 November 2025 |
18.79 (-0.48%) |
18.84 |
18.60 - 18.92 |
1.5091 times |
Fri 21 November 2025 |
18.88 (4.54%) |
18.20 |
18.16 - 19.02 |
1.0016 times |
Thu 20 November 2025 |
18.06 (-0.39%) |
18.34 |
18.06 - 18.58 |
0.7699 times |
Wed 19 November 2025 |
18.13 (0.67%) |
18.06 |
17.93 - 18.23 |
0.7086 times |
Weekly price and charts ProvidentFinancial Strong weekly Stock price targets for ProvidentFinancial PFS are 19.57 and 20.59 | Weekly Target 1 | 18.74 | | Weekly Target 2 | 19.38 | | Weekly Target 3 | 19.756666666667 | | Weekly Target 4 | 20.4 | | Weekly Target 5 | 20.78 |
Weekly price and volumes for Provident Financial
| Date |
Closing |
Open |
Range |
Volume |
Thu 04 December 2025 |
20.03 (4.43%) |
19.13 |
19.11 - 20.13 |
1.0232 times |
Fri 28 November 2025 |
19.18 (1.59%) |
18.84 |
18.60 - 19.66 |
1.6804 times |
Fri 21 November 2025 |
18.88 (1.83%) |
18.48 |
17.71 - 19.02 |
1.3431 times |
Fri 14 November 2025 |
18.54 (-0.7%) |
18.71 |
18.15 - 19.24 |
1.2748 times |
Fri 07 November 2025 |
18.67 (2.08%) |
18.32 |
18.07 - 18.69 |
0.974 times |
Fri 31 October 2025 |
18.29 (0%) |
18.29 |
18.14 - 18.44 |
0.2509 times |
Fri 31 October 2025 |
18.29 (-3.69%) |
19.04 |
18.08 - 19.13 |
1.1391 times |
Fri 24 October 2025 |
18.99 (4%) |
18.36 |
18.20 - 19.06 |
0.7695 times |
Fri 17 October 2025 |
18.26 (-7.07%) |
18.81 |
17.69 - 19.62 |
1.1102 times |
Tue 07 October 2025 |
19.65 (-0.2%) |
19.84 |
19.58 - 20.29 |
0.4349 times |
Fri 03 October 2025 |
19.69 (0.41%) |
19.62 |
18.97 - 19.88 |
0.9718 times |
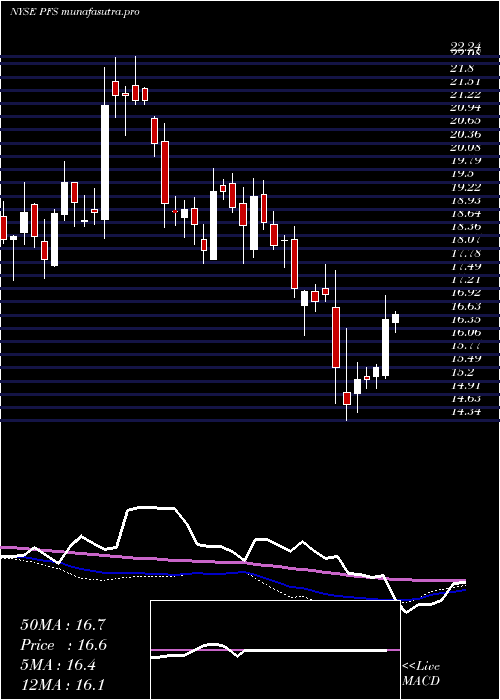
Monthly price and charts ProvidentFinancial Strong monthly Stock price targets for ProvidentFinancial PFS are 19.57 and 20.59 | Monthly Target 1 | 18.74 | | Monthly Target 2 | 19.38 | | Monthly Target 3 | 19.756666666667 | | Monthly Target 4 | 20.4 | | Monthly Target 5 | 20.78 |
Monthly price and volumes Provident Financial
| Date |
Closing |
Open |
Range |
Volume |
Thu 04 December 2025 |
20.03 (4.43%) |
19.13 |
19.11 - 20.13 |
0.2461 times |
Fri 28 November 2025 |
19.18 (4.87%) |
18.32 |
17.71 - 19.66 |
1.2683 times |
Fri 31 October 2025 |
18.29 (-5.13%) |
19.18 |
17.69 - 20.29 |
1.0238 times |
Tue 30 September 2025 |
19.28 (-2.82%) |
19.56 |
19.01 - 20.42 |
0.9894 times |
Fri 29 August 2025 |
19.84 (8.89%) |
17.88 |
17.61 - 20.09 |
0.9603 times |
Thu 31 July 2025 |
18.22 (3.94%) |
17.40 |
17.40 - 19.48 |
1.0862 times |
Mon 30 June 2025 |
17.53 (4.97%) |
16.61 |
15.92 - 18.00 |
1.0864 times |
Fri 30 May 2025 |
16.70 (2.02%) |
16.39 |
16.27 - 18.10 |
0.8681 times |
Wed 30 April 2025 |
16.37 (-4.66%) |
16.95 |
14.34 - 17.60 |
1.4588 times |
Mon 31 March 2025 |
17.17 (-5.92%) |
18.28 |
16.20 - 18.55 |
1.0127 times |
Fri 28 February 2025 |
18.25 (-1.72%) |
18.06 |
17.66 - 19.60 |
0.8719 times |

DMA SMA EMA moving averages of Provident Financial PFS
DMA (daily moving average) of Provident Financial PFS
| DMA period | DMA value | | 5 day DMA | 19.61 | | 12 day DMA | 19.05 | | 20 day DMA | 18.85 | | 35 day DMA | 18.71 | | 50 day DMA | 18.95 | | 100 day DMA | 19.03 | | 150 day DMA | 18.41 | | 200 day DMA | 18.02 | EMA (exponential moving average) of Provident Financial PFS
| EMA period | EMA current | EMA prev | EMA prev2 | | 5 day EMA | 19.68 | 19.5 | 19.27 | | 12 day EMA | 19.27 | 19.13 | 18.98 | | 20 day EMA | 19.07 | 18.97 | 18.87 | | 35 day EMA | 19.04 | 18.98 | 18.92 | | 50 day EMA | 19.1 | 19.06 | 19.02 |
SMA (simple moving average) of Provident Financial PFS
| SMA period | SMA current | SMA prev | SMA prev2 | | 5 day SMA | 19.61 | 19.46 | 19.36 | | 12 day SMA | 19.05 | 18.87 | 18.75 | | 20 day SMA | 18.85 | 18.77 | 18.69 | | 35 day SMA | 18.71 | 18.69 | 18.68 | | 50 day SMA | 18.95 | 18.95 | 18.95 | | 100 day SMA | 19.03 | 19.01 | 19 | | 150 day SMA | 18.41 | 18.38 | 18.36 | | 200 day SMA | 18.02 | 18.02 | 18.02 |
|
|
