PebblebrookHotel PEB full analysis,charts,indicators,moving averages,SMA,DMA,EMA,ADX,MACD,RSIPebblebrook Hotel PEB WideScreen charts, DMA,SMA,EMA technical analysis, forecast prediction, by indicators ADX,MACD,RSI,CCI NYSE stock exchange
operates under Consumer Services sector & deals in Real Estate Investment Trusts
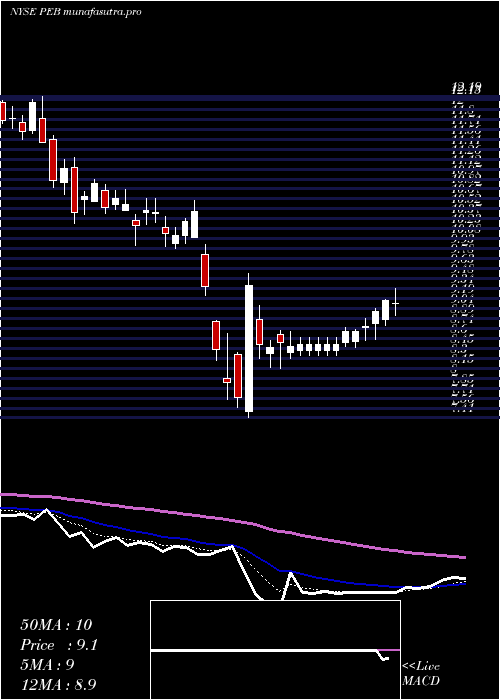
Daily price and charts and targets PebblebrookHotel Strong Daily Stock price targets for PebblebrookHotel PEB are 10.61 and 10.86 | Daily Target 1 | 10.55 | | Daily Target 2 | 10.67 | | Daily Target 3 | 10.803333333333 | | Daily Target 4 | 10.92 | | Daily Target 5 | 11.05 |
Daily price and volume Pebblebrook Hotel
| Date |
Closing |
Open |
Range |
Volume |
Fri 05 December 2025 |
10.78 (-0.09%) |
10.81 |
10.69 - 10.94 |
0.6274 times |
Thu 04 December 2025 |
10.79 (-2%) |
10.92 |
10.69 - 11.07 |
0.9704 times |
Wed 03 December 2025 |
11.01 (-1.08%) |
11.15 |
10.94 - 11.28 |
0.8388 times |
Tue 02 December 2025 |
11.13 (-1.15%) |
11.38 |
11.08 - 11.38 |
1.366 times |
Mon 01 December 2025 |
11.26 (-0.71%) |
11.25 |
11.11 - 11.41 |
0.7536 times |
Fri 28 November 2025 |
11.34 (0.09%) |
11.33 |
11.24 - 11.50 |
0.4288 times |
Wed 26 November 2025 |
11.33 (-1.22%) |
11.50 |
11.33 - 11.58 |
0.8783 times |
Tue 25 November 2025 |
11.47 (2.87%) |
11.24 |
11.16 - 11.56 |
1.1246 times |
Mon 24 November 2025 |
11.15 (0.72%) |
11.12 |
10.97 - 11.30 |
1.5481 times |
Fri 21 November 2025 |
11.07 (5.33%) |
10.64 |
10.51 - 11.18 |
1.4641 times |
Thu 20 November 2025 |
10.51 (-1.04%) |
10.71 |
10.46 - 10.91 |
1.0029 times |
Weekly price and charts PebblebrookHotel Strong weekly Stock price targets for PebblebrookHotel PEB are 10.38 and 11.1 | Weekly Target 1 | 10.24 | | Weekly Target 2 | 10.51 | | Weekly Target 3 | 10.96 | | Weekly Target 4 | 11.23 | | Weekly Target 5 | 11.68 |
Weekly price and volumes for Pebblebrook Hotel
| Date |
Closing |
Open |
Range |
Volume |
Fri 05 December 2025 |
10.78 (-4.94%) |
11.25 |
10.69 - 11.41 |
1.111 times |
Fri 28 November 2025 |
11.34 (2.44%) |
11.12 |
10.97 - 11.58 |
0.9704 times |
Fri 21 November 2025 |
11.07 (-0.18%) |
11.09 |
10.46 - 11.18 |
1.194 times |
Fri 14 November 2025 |
11.09 (-1.86%) |
11.24 |
10.96 - 11.63 |
1.1228 times |
Fri 07 November 2025 |
11.30 (8.03%) |
10.29 |
9.99 - 11.33 |
1.4012 times |
Fri 31 October 2025 |
10.46 (0%) |
10.57 |
10.32 - 10.67 |
0.29 times |
Fri 31 October 2025 |
10.46 (-4.91%) |
11.10 |
10.32 - 11.26 |
0.8853 times |
Fri 24 October 2025 |
11.00 (2.04%) |
10.84 |
10.56 - 11.28 |
1.321 times |
Fri 17 October 2025 |
10.78 (1.32%) |
10.38 |
10.09 - 11.03 |
1.2 times |
Tue 07 October 2025 |
10.64 (-3.8%) |
11.07 |
10.63 - 11.21 |
0.5042 times |
Fri 03 October 2025 |
11.06 (-3.57%) |
11.56 |
11.04 - 11.71 |
1.2934 times |
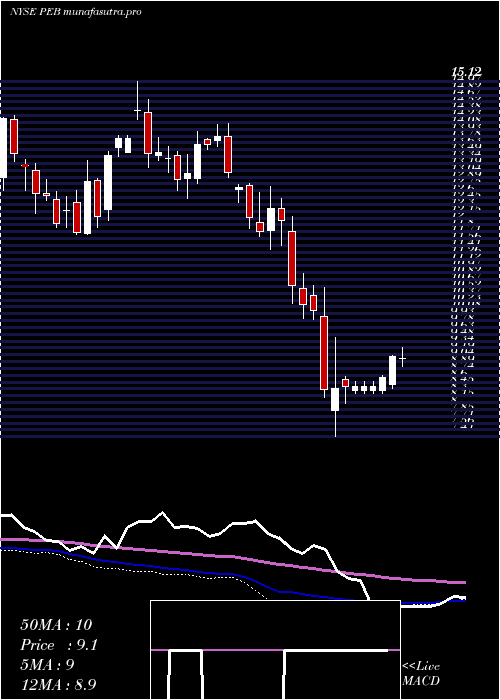
Monthly price and charts PebblebrookHotel Strong monthly Stock price targets for PebblebrookHotel PEB are 10.38 and 11.1 | Monthly Target 1 | 10.24 | | Monthly Target 2 | 10.51 | | Monthly Target 3 | 10.96 | | Monthly Target 4 | 11.23 | | Monthly Target 5 | 11.68 |
Monthly price and volumes Pebblebrook Hotel
| Date |
Closing |
Open |
Range |
Volume |
Fri 05 December 2025 |
10.78 (-4.94%) |
11.25 |
10.69 - 11.41 |
0.1989 times |
Fri 28 November 2025 |
11.34 (8.41%) |
10.29 |
9.99 - 11.63 |
0.8392 times |
Fri 31 October 2025 |
10.46 (-8.17%) |
11.21 |
10.09 - 11.42 |
0.8773 times |
Tue 30 September 2025 |
11.39 (2.24%) |
11.00 |
10.87 - 12.35 |
1.5066 times |
Fri 29 August 2025 |
11.14 (11.07%) |
9.83 |
9.30 - 11.34 |
0.9764 times |
Thu 31 July 2025 |
10.03 (0.4%) |
9.95 |
9.82 - 11.24 |
1.1445 times |
Mon 30 June 2025 |
9.99 (8.82%) |
9.13 |
8.80 - 10.15 |
1.0772 times |
Fri 30 May 2025 |
9.18 (1.44%) |
9.22 |
8.69 - 10.76 |
0.9833 times |
Wed 30 April 2025 |
9.05 (-10.66%) |
10.13 |
7.41 - 10.65 |
1.2989 times |
Mon 31 March 2025 |
10.13 (-17.98%) |
12.37 |
9.93 - 12.57 |
1.0977 times |
Fri 28 February 2025 |
12.35 (-5.94%) |
12.77 |
11.47 - 12.90 |
0.9483 times |

DMA SMA EMA moving averages of Pebblebrook Hotel PEB
DMA (daily moving average) of Pebblebrook Hotel PEB
| DMA period | DMA value | | 5 day DMA | 10.99 | | 12 day DMA | 11.04 | | 20 day DMA | 11.09 | | 35 day DMA | 10.92 | | 50 day DMA | 10.97 | | 100 day DMA | 10.86 | | 150 day DMA | 10.46 | | 200 day DMA | 10.4 | EMA (exponential moving average) of Pebblebrook Hotel PEB
| EMA period | EMA current | EMA prev | EMA prev2 | | 5 day EMA | 10.94 | 11.02 | 11.14 | | 12 day EMA | 11.01 | 11.05 | 11.1 | | 20 day EMA | 11.01 | 11.03 | 11.06 | | 35 day EMA | 11.05 | 11.07 | 11.09 | | 50 day EMA | 11.04 | 11.05 | 11.06 |
SMA (simple moving average) of Pebblebrook Hotel PEB
| SMA period | SMA current | SMA prev | SMA prev2 | | 5 day SMA | 10.99 | 11.11 | 11.21 | | 12 day SMA | 11.04 | 11.04 | 11.05 | | 20 day SMA | 11.09 | 11.07 | 11.04 | | 35 day SMA | 10.92 | 10.92 | 10.92 | | 50 day SMA | 10.97 | 10.99 | 11.01 | | 100 day SMA | 10.86 | 10.86 | 10.86 | | 150 day SMA | 10.46 | 10.45 | 10.44 | | 200 day SMA | 10.4 | 10.41 | 10.42 |
|
|
