PimcoDynamic PDI full analysis,charts,indicators,moving averages,SMA,DMA,EMA,ADX,MACD,RSIPimco Dynamic PDI WideScreen charts, DMA,SMA,EMA technical analysis, forecast prediction, by indicators ADX,MACD,RSI,CCI NYSE stock exchange
operates under N A sector & deals in N A
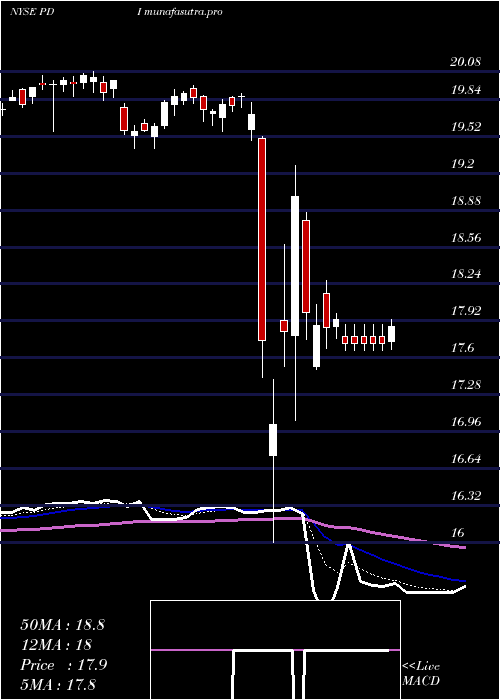
Daily price and charts and targets PimcoDynamic Strong Daily Stock price targets for PimcoDynamic PDI are 18 and 18.98 | Daily Target 1 | 17.21 | | Daily Target 2 | 17.81 | | Daily Target 3 | 18.193333333333 | | Daily Target 4 | 18.79 | | Daily Target 5 | 19.17 |
Daily price and volume Pimco Dynamic
| Date |
Closing |
Open |
Range |
Volume |
Tue 21 October 2025 |
18.40 (2.11%) |
17.72 |
17.60 - 18.58 |
1.6114 times |
Mon 20 October 2025 |
18.02 (-4.91%) |
19.06 |
17.68 - 19.13 |
3.4585 times |
Fri 17 October 2025 |
18.95 (-1.81%) |
19.16 |
18.62 - 19.16 |
1.3092 times |
Thu 16 October 2025 |
19.30 (-1.18%) |
19.53 |
19.25 - 19.56 |
0.6635 times |
Wed 15 October 2025 |
19.53 (-0.1%) |
19.57 |
19.38 - 19.57 |
0.6778 times |
Tue 14 October 2025 |
19.55 (-1.36%) |
19.50 |
19.43 - 19.62 |
0.5212 times |
Mon 13 October 2025 |
19.82 (-0.45%) |
19.83 |
19.78 - 19.87 |
0.4977 times |
Tue 07 October 2025 |
19.91 (0%) |
19.93 |
19.91 - 19.96 |
0.3877 times |
Mon 06 October 2025 |
19.91 (-0.15%) |
19.87 |
19.87 - 19.93 |
0.4309 times |
Fri 03 October 2025 |
19.94 (0.3%) |
19.84 |
19.82 - 19.94 |
0.4422 times |
Thu 02 October 2025 |
19.88 (0.2%) |
19.88 |
19.82 - 19.91 |
0.3485 times |
Weekly price and charts PimcoDynamic Strong weekly Stock price targets for PimcoDynamic PDI are 17.24 and 18.77 | Weekly Target 1 | 16.85 | | Weekly Target 2 | 17.62 | | Weekly Target 3 | 18.376666666667 | | Weekly Target 4 | 19.15 | | Weekly Target 5 | 19.91 |
Weekly price and volumes for Pimco Dynamic
| Date |
Closing |
Open |
Range |
Volume |
Tue 21 October 2025 |
18.40 (-2.9%) |
19.06 |
17.60 - 19.13 |
2.2316 times |
Fri 17 October 2025 |
18.95 (-4.82%) |
19.83 |
18.62 - 19.87 |
1.6151 times |
Tue 07 October 2025 |
19.91 (-0.15%) |
19.87 |
19.87 - 19.96 |
0.3603 times |
Fri 03 October 2025 |
19.94 (0.96%) |
19.78 |
19.72 - 19.94 |
0.8051 times |
Fri 26 September 2025 |
19.75 (-0.4%) |
19.84 |
19.63 - 19.86 |
0.6625 times |
Fri 19 September 2025 |
19.83 (-0.1%) |
19.89 |
19.59 - 19.91 |
1.0408 times |
Fri 12 September 2025 |
19.85 (-0.9%) |
20.15 |
19.75 - 20.17 |
1.3394 times |
Fri 05 September 2025 |
20.03 (1.93%) |
19.53 |
19.43 - 20.05 |
1.0218 times |
Fri 29 August 2025 |
19.65 (0%) |
19.48 |
19.48 - 19.65 |
0.1916 times |
Fri 29 August 2025 |
19.65 (1.71%) |
19.37 |
19.31 - 19.65 |
0.7317 times |
Fri 22 August 2025 |
19.32 (0.63%) |
19.22 |
19.20 - 19.39 |
0.7239 times |

Monthly price and charts PimcoDynamic Strong monthly Stock price targets for PimcoDynamic PDI are 16.82 and 19.18 | Monthly Target 1 | 16.29 | | Monthly Target 2 | 17.35 | | Monthly Target 3 | 18.653333333333 | | Monthly Target 4 | 19.71 | | Monthly Target 5 | 21.01 |
Monthly price and volumes Pimco Dynamic
| Date |
Closing |
Open |
Range |
Volume |
Tue 21 October 2025 |
18.40 (-7.07%) |
19.82 |
17.60 - 19.96 |
1.2005 times |
Tue 30 September 2025 |
19.80 (0.76%) |
19.53 |
19.43 - 20.17 |
1.092 times |
Fri 29 August 2025 |
19.65 (2.34%) |
19.18 |
19.06 - 19.65 |
0.8638 times |
Thu 31 July 2025 |
19.20 (1.21%) |
19.02 |
18.75 - 19.23 |
0.8673 times |
Mon 30 June 2025 |
18.97 (1.55%) |
18.74 |
18.55 - 19.08 |
0.6879 times |
Fri 30 May 2025 |
18.68 (1.08%) |
18.65 |
18.16 - 19.12 |
0.8018 times |
Wed 30 April 2025 |
18.48 (-6.67%) |
19.86 |
16.00 - 19.89 |
1.5411 times |
Mon 31 March 2025 |
19.80 (-0.75%) |
19.98 |
19.42 - 20.08 |
1.0977 times |
Fri 28 February 2025 |
19.95 (3.15%) |
19.29 |
19.23 - 19.95 |
0.8897 times |
Fri 31 January 2025 |
19.34 (5.45%) |
18.48 |
18.45 - 19.34 |
0.9581 times |
Tue 31 December 2024 |
18.34 (-3.73%) |
19.31 |
18.17 - 19.33 |
0.7643 times |

DMA SMA EMA moving averages of Pimco Dynamic PDI
DMA (daily moving average) of Pimco Dynamic PDI
| DMA period | DMA value | | 5 day DMA | 18.84 | | 12 day DMA | 19.42 | | 20 day DMA | 19.56 | | 35 day DMA | 19.69 | | 50 day DMA | 19.56 | | 100 day DMA | 19.25 | | 150 day DMA | 19.06 | | 200 day DMA | 19.14 | EMA (exponential moving average) of Pimco Dynamic PDI
| EMA period | EMA current | EMA prev | EMA prev2 | | 5 day EMA | 18.74 | 18.91 | 19.35 | | 12 day EMA | 19.2 | 19.34 | 19.58 | | 20 day EMA | 19.4 | 19.5 | 19.66 | | 35 day EMA | 19.46 | 19.52 | 19.61 | | 50 day EMA | 19.46 | 19.5 | 19.56 |
SMA (simple moving average) of Pimco Dynamic PDI
| SMA period | SMA current | SMA prev | SMA prev2 | | 5 day SMA | 18.84 | 19.07 | 19.43 | | 12 day SMA | 19.42 | 19.54 | 19.68 | | 20 day SMA | 19.56 | 19.63 | 19.71 | | 35 day SMA | 19.69 | 19.72 | 19.76 | | 50 day SMA | 19.56 | 19.58 | 19.61 | | 100 day SMA | 19.25 | 19.25 | 19.25 | | 150 day SMA | 19.06 | 19.07 | 19.08 | | 200 day SMA | 19.14 | 19.14 | 19.15 |
|
|
