PimcoCorporate PCN full analysis,charts,indicators,moving averages,SMA,DMA,EMA,ADX,MACD,RSIPimco Corporate PCN WideScreen charts, DMA,SMA,EMA technical analysis, forecast prediction, by indicators ADX,MACD,RSI,CCI NYSE stock exchange
operates under N A sector & deals in N A
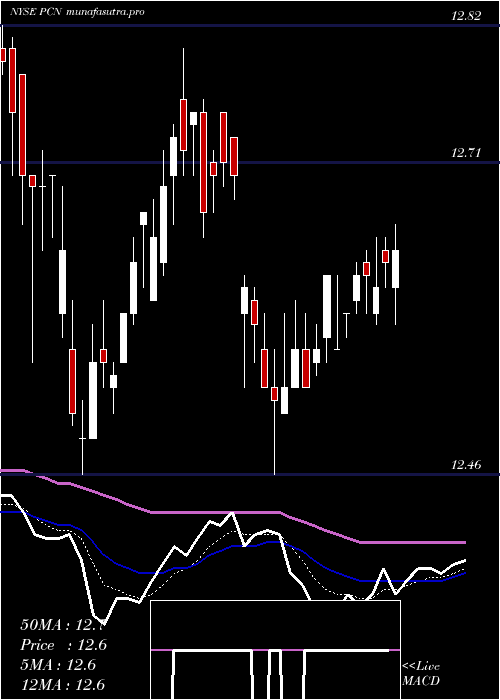
Daily price and charts and targets PimcoCorporate Strong Daily Stock price targets for PimcoCorporate PCN are 12.74 and 13.15 | Daily Target 1 | 12.39 | | Daily Target 2 | 12.67 | | Daily Target 3 | 12.803333333333 | | Daily Target 4 | 13.08 | | Daily Target 5 | 13.21 |
Daily price and volume Pimco Corporate
| Date |
Closing |
Open |
Range |
Volume |
Tue 21 October 2025 |
12.94 (3.35%) |
12.55 |
12.53 - 12.94 |
0.9878 times |
Mon 20 October 2025 |
12.52 (-2.42%) |
12.82 |
12.46 - 12.83 |
2.1083 times |
Fri 17 October 2025 |
12.83 (-2.21%) |
13.08 |
12.75 - 13.12 |
1.98 times |
Thu 16 October 2025 |
13.12 (-1.43%) |
13.32 |
13.09 - 13.33 |
0.9608 times |
Wed 15 October 2025 |
13.31 (0.3%) |
13.34 |
13.26 - 13.36 |
0.7583 times |
Tue 14 October 2025 |
13.27 (-1.12%) |
13.28 |
13.21 - 13.32 |
0.5461 times |
Mon 13 October 2025 |
13.42 (0.07%) |
13.47 |
13.37 - 13.47 |
0.9727 times |
Tue 07 October 2025 |
13.41 (-0.07%) |
13.43 |
13.40 - 13.44 |
0.6124 times |
Mon 06 October 2025 |
13.42 (0.07%) |
13.44 |
13.37 - 13.44 |
0.6155 times |
Fri 03 October 2025 |
13.41 (-0.07%) |
13.40 |
13.36 - 13.42 |
0.458 times |
Thu 02 October 2025 |
13.42 (0.6%) |
13.40 |
13.34 - 13.42 |
0.4912 times |
Weekly price and charts PimcoCorporate Strong weekly Stock price targets for PimcoCorporate PCN are 12.7 and 13.18 | Weekly Target 1 | 12.3 | | Weekly Target 2 | 12.62 | | Weekly Target 3 | 12.78 | | Weekly Target 4 | 13.1 | | Weekly Target 5 | 13.26 |
Weekly price and volumes for Pimco Corporate
| Date |
Closing |
Open |
Range |
Volume |
Tue 21 October 2025 |
12.94 (0.86%) |
12.82 |
12.46 - 12.94 |
0.9861 times |
Fri 17 October 2025 |
12.83 (-4.33%) |
13.47 |
12.75 - 13.47 |
1.6619 times |
Tue 07 October 2025 |
13.41 (0%) |
13.44 |
13.37 - 13.44 |
0.3911 times |
Fri 03 October 2025 |
13.41 (0.3%) |
13.44 |
13.30 - 13.44 |
0.9685 times |
Fri 26 September 2025 |
13.37 (0.3%) |
13.37 |
13.35 - 13.46 |
0.9787 times |
Fri 19 September 2025 |
13.33 (1.06%) |
13.23 |
13.23 - 13.42 |
1.1847 times |
Fri 12 September 2025 |
13.19 (0.61%) |
13.14 |
13.14 - 13.33 |
1.3412 times |
Fri 05 September 2025 |
13.11 (0.31%) |
13.05 |
12.96 - 13.13 |
1.0317 times |
Fri 29 August 2025 |
13.07 (0%) |
13.03 |
12.98 - 13.07 |
0.2787 times |
Fri 29 August 2025 |
13.07 (1.63%) |
12.90 |
12.84 - 13.07 |
1.1774 times |
Fri 22 August 2025 |
12.86 (1.42%) |
12.68 |
12.68 - 12.93 |
1.1118 times |

Monthly price and charts PimcoCorporate Strong monthly Stock price targets for PimcoCorporate PCN are 12.2 and 13.21 | Monthly Target 1 | 11.95 | | Monthly Target 2 | 12.44 | | Monthly Target 3 | 12.956666666667 | | Monthly Target 4 | 13.45 | | Monthly Target 5 | 13.97 |
Monthly price and volumes Pimco Corporate
| Date |
Closing |
Open |
Range |
Volume |
Tue 21 October 2025 |
12.94 (-3.29%) |
13.40 |
12.46 - 13.47 |
0.9388 times |
Tue 30 September 2025 |
13.38 (2.37%) |
13.05 |
12.96 - 13.46 |
1.3104 times |
Fri 29 August 2025 |
13.07 (3.48%) |
12.61 |
12.58 - 13.07 |
1.12 times |
Thu 31 July 2025 |
12.63 (-0.47%) |
12.70 |
12.46 - 12.80 |
1.0815 times |
Mon 30 June 2025 |
12.69 (-0.47%) |
12.75 |
12.46 - 12.82 |
0.8947 times |
Fri 30 May 2025 |
12.75 (-0.16%) |
12.95 |
12.50 - 12.98 |
0.8966 times |
Wed 30 April 2025 |
12.77 (-6.45%) |
13.68 |
11.30 - 13.70 |
1.4372 times |
Mon 31 March 2025 |
13.65 (0%) |
13.65 |
13.30 - 13.77 |
0.7627 times |
Fri 28 February 2025 |
13.65 (0.29%) |
13.54 |
13.53 - 13.84 |
0.6554 times |
Fri 31 January 2025 |
13.61 (1.42%) |
13.45 |
13.23 - 13.63 |
0.9026 times |
Tue 31 December 2024 |
13.42 (-4.62%) |
14.01 |
13.18 - 14.16 |
0.7968 times |

DMA SMA EMA moving averages of Pimco Corporate PCN
DMA (daily moving average) of Pimco Corporate PCN
| DMA period | DMA value | | 5 day DMA | 12.94 | | 12 day DMA | 13.2 | | 20 day DMA | 13.28 | | 35 day DMA | 13.24 | | 50 day DMA | 13.11 | | 100 day DMA | 12.88 | | 150 day DMA | 12.88 | | 200 day DMA | 13.06 | EMA (exponential moving average) of Pimco Corporate PCN
| EMA period | EMA current | EMA prev | EMA prev2 | | 5 day EMA | 12.93 | 12.92 | 13.12 | | 12 day EMA | 13.1 | 13.13 | 13.24 | | 20 day EMA | 13.17 | 13.19 | 13.26 | | 35 day EMA | 13.13 | 13.14 | 13.18 | | 50 day EMA | 13.06 | 13.06 | 13.08 |
SMA (simple moving average) of Pimco Corporate PCN
| SMA period | SMA current | SMA prev | SMA prev2 | | 5 day SMA | 12.94 | 13.01 | 13.19 | | 12 day SMA | 13.2 | 13.24 | 13.31 | | 20 day SMA | 13.28 | 13.3 | 13.33 | | 35 day SMA | 13.24 | 13.25 | 13.26 | | 50 day SMA | 13.11 | 13.1 | 13.1 | | 100 day SMA | 12.88 | 12.87 | 12.87 | | 150 day SMA | 12.88 | 12.88 | 12.89 | | 200 day SMA | 13.06 | 13.06 | 13.06 |
|
|
