HighIncome PCF full analysis,charts,indicators,moving averages,SMA,DMA,EMA,ADX,MACD,RSIHigh Income PCF WideScreen charts, DMA,SMA,EMA technical analysis, forecast prediction, by indicators ADX,MACD,RSI,CCI NYSE stock exchange
operates under N A sector & deals in N A
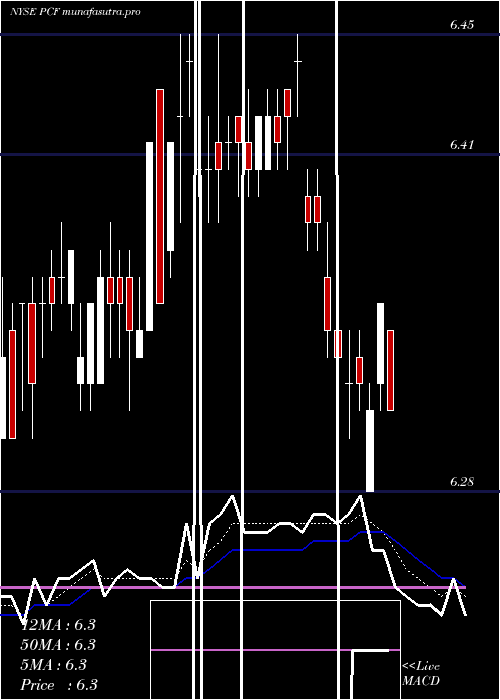
Daily price and charts and targets HighIncome Strong Daily Stock price targets for HighIncome PCF are 6.25 and 6.3 | Daily Target 1 | 6.21 | | Daily Target 2 | 6.23 | | Daily Target 3 | 6.2566666666667 | | Daily Target 4 | 6.28 | | Daily Target 5 | 6.31 |
Daily price and volume High Income
| Date |
Closing |
Open |
Range |
Volume |
Fri 05 December 2025 |
6.26 (0.16%) |
6.23 |
6.23 - 6.28 |
0.4149 times |
Thu 04 December 2025 |
6.25 (0.16%) |
6.25 |
6.23 - 6.25 |
0.4629 times |
Wed 03 December 2025 |
6.24 (0.32%) |
6.24 |
6.22 - 6.24 |
0.8532 times |
Tue 02 December 2025 |
6.22 (-0.16%) |
6.23 |
6.22 - 6.24 |
0.6058 times |
Mon 01 December 2025 |
6.23 (-0.32%) |
6.24 |
6.21 - 6.24 |
1.3827 times |
Fri 28 November 2025 |
6.25 (0.81%) |
6.23 |
6.22 - 6.25 |
0.7597 times |
Wed 26 November 2025 |
6.20 (0.65%) |
6.15 |
6.15 - 6.24 |
0.9739 times |
Tue 25 November 2025 |
6.16 (0.49%) |
6.14 |
6.14 - 6.17 |
0.4826 times |
Mon 24 November 2025 |
6.13 (-0.33%) |
6.09 |
6.09 - 6.14 |
0.937 times |
Fri 21 November 2025 |
6.15 (1.32%) |
6.10 |
5.92 - 6.15 |
3.1273 times |
Thu 20 November 2025 |
6.07 (-1.46%) |
6.16 |
6.07 - 6.19 |
1.0379 times |
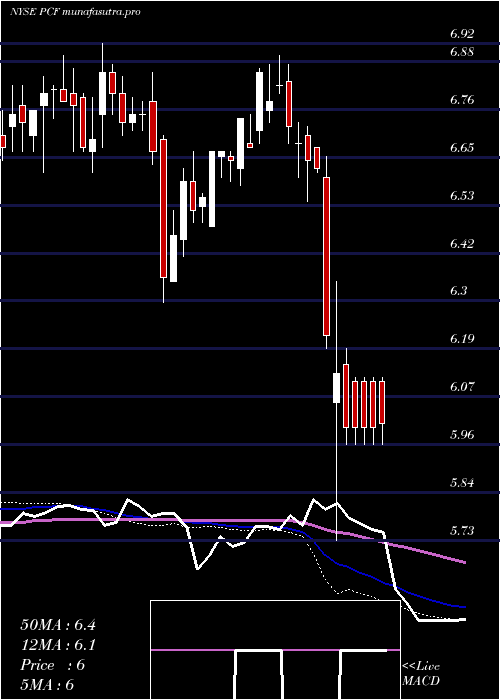
Weekly price and charts HighIncome Strong weekly Stock price targets for HighIncome PCF are 6.24 and 6.31 | Weekly Target 1 | 6.18 | | Weekly Target 2 | 6.22 | | Weekly Target 3 | 6.25 | | Weekly Target 4 | 6.29 | | Weekly Target 5 | 6.32 |
Weekly price and volumes for High Income
| Date |
Closing |
Open |
Range |
Volume |
Fri 05 December 2025 |
6.26 (0.16%) |
6.24 |
6.21 - 6.28 |
0.8946 times |
Fri 28 November 2025 |
6.25 (1.63%) |
6.09 |
6.09 - 6.25 |
0.7584 times |
Fri 21 November 2025 |
6.15 (-2.07%) |
6.27 |
5.92 - 6.29 |
1.676 times |
Fri 14 November 2025 |
6.28 (0.16%) |
6.26 |
6.26 - 6.31 |
0.6968 times |
Fri 07 November 2025 |
6.27 (-0.32%) |
6.25 |
6.21 - 6.27 |
0.8653 times |
Fri 31 October 2025 |
6.29 (0%) |
6.29 |
6.27 - 6.30 |
0.2094 times |
Fri 31 October 2025 |
6.29 (0.48%) |
6.28 |
6.24 - 6.30 |
0.8647 times |
Fri 24 October 2025 |
6.26 (-0.16%) |
6.37 |
6.17 - 6.37 |
1.4883 times |
Fri 17 October 2025 |
6.27 (0.16%) |
6.25 |
6.20 - 6.35 |
1.4859 times |
Tue 07 October 2025 |
6.26 (-0.32%) |
6.28 |
6.21 - 6.33 |
1.0607 times |
Fri 03 October 2025 |
6.28 (-1.1%) |
6.35 |
6.28 - 6.40 |
1.5066 times |
Monthly price and charts HighIncome Strong monthly Stock price targets for HighIncome PCF are 6.24 and 6.31 | Monthly Target 1 | 6.18 | | Monthly Target 2 | 6.22 | | Monthly Target 3 | 6.25 | | Monthly Target 4 | 6.29 | | Monthly Target 5 | 6.32 |
Monthly price and volumes High Income
| Date |
Closing |
Open |
Range |
Volume |
Fri 05 December 2025 |
6.26 (0.16%) |
6.24 |
6.21 - 6.28 |
0.2303 times |
Fri 28 November 2025 |
6.25 (-0.64%) |
6.25 |
5.92 - 6.31 |
1.0288 times |
Fri 31 October 2025 |
6.29 (-0.94%) |
6.32 |
6.17 - 6.38 |
1.5223 times |
Tue 30 September 2025 |
6.35 (-2.16%) |
6.47 |
6.31 - 6.49 |
1.2411 times |
Fri 29 August 2025 |
6.49 (2.2%) |
6.34 |
6.31 - 6.51 |
0.9944 times |
Thu 31 July 2025 |
6.35 (0%) |
6.37 |
6.28 - 6.45 |
1.0991 times |
Mon 30 June 2025 |
6.35 (0.47%) |
6.33 |
6.27 - 6.43 |
0.8725 times |
Fri 30 May 2025 |
6.32 (0.8%) |
6.33 |
6.16 - 6.43 |
1.0385 times |
Wed 30 April 2025 |
6.27 (-5.71%) |
6.62 |
5.73 - 6.64 |
1.1701 times |
Mon 31 March 2025 |
6.65 (-2.49%) |
6.83 |
6.54 - 6.87 |
0.8028 times |
Fri 28 February 2025 |
6.82 (1.19%) |
6.68 |
6.67 - 6.89 |
1.2423 times |

DMA SMA EMA moving averages of High Income PCF
DMA (daily moving average) of High Income PCF
| DMA period | DMA value | | 5 day DMA | 6.24 | | 12 day DMA | 6.19 | | 20 day DMA | 6.22 | | 35 day DMA | 6.24 | | 50 day DMA | 6.26 | | 100 day DMA | 6.33 | | 150 day DMA | 6.34 | | 200 day DMA | 6.37 | EMA (exponential moving average) of High Income PCF
| EMA period | EMA current | EMA prev | EMA prev2 | | 5 day EMA | 6.24 | 6.23 | 6.22 | | 12 day EMA | 6.23 | 6.22 | 6.21 | | 20 day EMA | 6.21 | 6.21 | 6.21 | | 35 day EMA | 6.25 | 6.25 | 6.25 | | 50 day EMA | 6.28 | 6.28 | 6.28 |
SMA (simple moving average) of High Income PCF
| SMA period | SMA current | SMA prev | SMA prev2 | | 5 day SMA | 6.24 | 6.24 | 6.23 | | 12 day SMA | 6.19 | 6.19 | 6.19 | | 20 day SMA | 6.22 | 6.22 | 6.22 | | 35 day SMA | 6.24 | 6.24 | 6.24 | | 50 day SMA | 6.26 | 6.27 | 6.27 | | 100 day SMA | 6.33 | 6.34 | 6.34 | | 150 day SMA | 6.34 | 6.34 | 6.34 | | 200 day SMA | 6.37 | 6.37 | 6.37 |
|
|
