PitneyBowes PBI-B full analysis,charts,indicators,moving averages,SMA,DMA,EMA,ADX,MACD,RSIPitney Bowes PBI-B WideScreen charts, DMA,SMA,EMA technical analysis, forecast prediction, by indicators ADX,MACD,RSI,CCI NYSE stock exchange
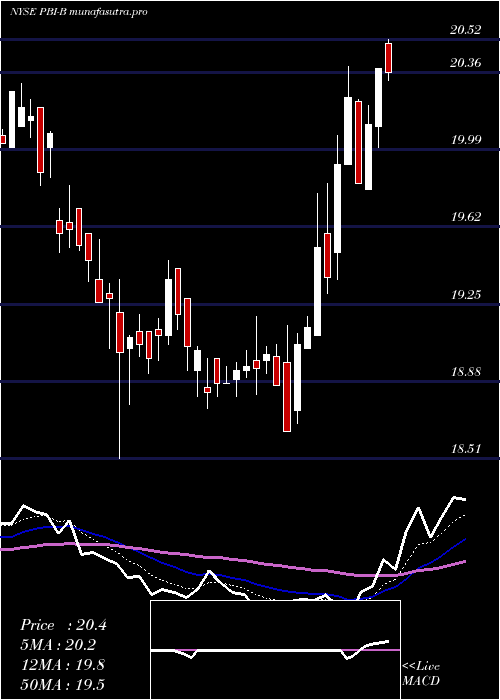
Daily price and charts and targets PitneyBowes Strong Daily Stock price targets for PitneyBowes PBI-B are 18.64 and 19.01 | Daily Target 1 | 18.36 | | Daily Target 2 | 18.54 | | Daily Target 3 | 18.73 | | Daily Target 4 | 18.91 | | Daily Target 5 | 19.1 |
Daily price and volume Pitney Bowes
| Date |
Closing |
Open |
Range |
Volume |
Mon 20 October 2025 |
18.72 (0.11%) |
18.70 |
18.55 - 18.92 |
2.6581 times |
Fri 17 October 2025 |
18.70 (-0.85%) |
18.87 |
18.50 - 19.10 |
2.665 times |
Thu 16 October 2025 |
18.86 (-2.43%) |
19.33 |
18.76 - 19.50 |
2.1594 times |
Wed 15 October 2025 |
19.33 (-1.63%) |
19.66 |
19.31 - 19.74 |
0.6684 times |
Tue 14 October 2025 |
19.65 (-0.25%) |
19.50 |
19.40 - 19.67 |
0.2588 times |
Mon 13 October 2025 |
19.70 (0.87%) |
19.56 |
19.47 - 19.70 |
0.4422 times |
Fri 10 October 2025 |
19.53 (-0.96%) |
19.60 |
19.42 - 19.71 |
0.1542 times |
Thu 09 October 2025 |
19.72 (0%) |
19.77 |
19.63 - 19.81 |
0.3188 times |
Wed 08 October 2025 |
19.72 (-0.7%) |
19.79 |
19.55 - 19.86 |
0.5656 times |
Tue 07 October 2025 |
19.86 (-0.1%) |
20.00 |
19.72 - 20.00 |
0.1097 times |
Mon 06 October 2025 |
19.88 (0.61%) |
19.81 |
19.65 - 19.91 |
0.1799 times |
Weekly price and charts PitneyBowes Strong weekly Stock price targets for PitneyBowes PBI-B are 18.64 and 19.01 | Weekly Target 1 | 18.36 | | Weekly Target 2 | 18.54 | | Weekly Target 3 | 18.73 | | Weekly Target 4 | 18.91 | | Weekly Target 5 | 19.1 |
Weekly price and volumes for Pitney Bowes
| Date |
Closing |
Open |
Range |
Volume |
Mon 20 October 2025 |
18.72 (0.11%) |
18.70 |
18.55 - 18.92 |
0.9442 times |
Fri 17 October 2025 |
18.70 (-4.25%) |
19.56 |
18.50 - 19.74 |
2.2 times |
Fri 10 October 2025 |
19.53 (-1.16%) |
19.81 |
19.42 - 20.00 |
0.4718 times |
Fri 03 October 2025 |
19.76 (2.01%) |
19.37 |
19.23 - 19.89 |
0.6581 times |
Fri 26 September 2025 |
19.37 (-4.16%) |
20.19 |
19.30 - 20.19 |
0.781 times |
Fri 19 September 2025 |
20.21 (0.65%) |
20.22 |
19.99 - 20.55 |
0.6958 times |
Fri 12 September 2025 |
20.08 (0.15%) |
20.18 |
19.91 - 20.37 |
1.3058 times |
Fri 05 September 2025 |
20.05 (2.93%) |
19.41 |
19.34 - 20.23 |
1.1061 times |
Fri 29 August 2025 |
19.48 (0%) |
19.72 |
19.35 - 19.77 |
0.476 times |
Fri 29 August 2025 |
19.48 (-4.46%) |
20.39 |
19.35 - 20.39 |
1.3612 times |
Fri 22 August 2025 |
20.39 (-2.3%) |
20.97 |
20.20 - 20.97 |
0.873 times |
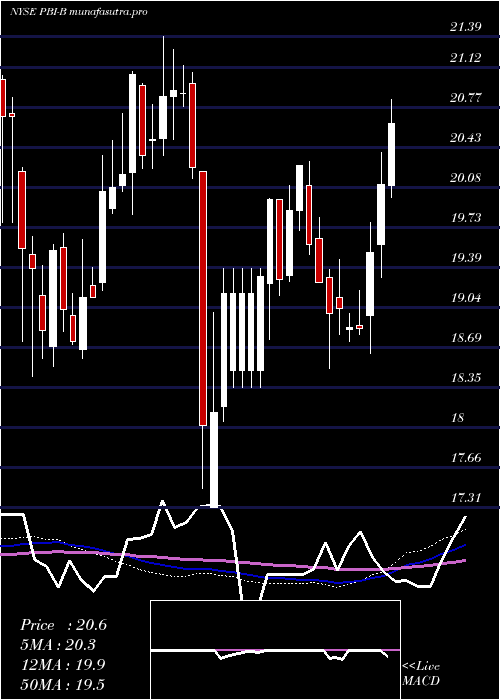
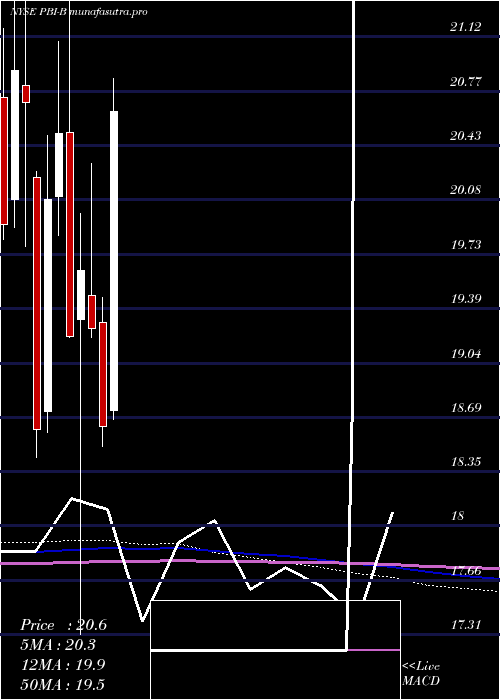
Monthly price and charts PitneyBowes Strong monthly Stock price targets for PitneyBowes PBI-B are 17.86 and 19.36 | Monthly Target 1 | 17.57 | | Monthly Target 2 | 18.15 | | Monthly Target 3 | 19.073333333333 | | Monthly Target 4 | 19.65 | | Monthly Target 5 | 20.57 |
Monthly price and volumes Pitney Bowes
| Date |
Closing |
Open |
Range |
Volume |
Mon 20 October 2025 |
18.72 (-3.36%) |
19.47 |
18.50 - 20.00 |
1.0291 times |
Tue 30 September 2025 |
19.37 (-0.56%) |
19.41 |
19.23 - 20.55 |
1.1937 times |
Fri 29 August 2025 |
19.48 (-7.77%) |
20.79 |
19.35 - 21.22 |
1.3247 times |
Thu 31 July 2025 |
21.12 (13.3%) |
18.74 |
18.68 - 21.30 |
1.0778 times |
Mon 30 June 2025 |
18.64 (-3.22%) |
19.30 |
18.51 - 19.46 |
0.9812 times |
Fri 30 May 2025 |
19.26 (-1.88%) |
19.47 |
19.20 - 20.31 |
0.7833 times |
Wed 30 April 2025 |
19.63 (2.19%) |
19.32 |
17.31 - 19.99 |
0.9999 times |
Mon 31 March 2025 |
19.21 (-6.29%) |
20.51 |
19.20 - 21.39 |
0.9785 times |
Fri 28 February 2025 |
20.50 (2.09%) |
20.10 |
19.85 - 21.09 |
0.6997 times |
Fri 31 January 2025 |
20.08 (7.84%) |
18.73 |
18.60 - 20.49 |
0.932 times |
Tue 31 December 2024 |
18.62 (-10.05%) |
20.22 |
18.44 - 20.26 |
0.9796 times |
DMA SMA EMA moving averages of Pitney Bowes PBI-B
DMA (daily moving average) of Pitney Bowes PBI-B
| DMA period | DMA value | | 5 day DMA | 19.05 | | 12 day DMA | 19.45 | | 20 day DMA | 19.53 | | 35 day DMA | 19.75 | | 50 day DMA | 19.95 | | 100 day DMA | 19.88 | | 150 day DMA | 19.77 | | 200 day DMA | 19.86 | EMA (exponential moving average) of Pitney Bowes PBI-B
| EMA period | EMA current | EMA prev | EMA prev2 | | 5 day EMA | 18.99 | 19.12 | 19.33 | | 12 day EMA | 19.3 | 19.4 | 19.53 | | 20 day EMA | 19.5 | 19.58 | 19.67 | | 35 day EMA | 19.71 | 19.77 | 19.83 | | 50 day EMA | 19.93 | 19.98 | 20.03 |
SMA (simple moving average) of Pitney Bowes PBI-B
| SMA period | SMA current | SMA prev | SMA prev2 | | 5 day SMA | 19.05 | 19.25 | 19.41 | | 12 day SMA | 19.45 | 19.54 | 19.59 | | 20 day SMA | 19.53 | 19.6 | 19.69 | | 35 day SMA | 19.75 | 19.77 | 19.8 | | 50 day SMA | 19.95 | 19.99 | 20.03 | | 100 day SMA | 19.88 | 19.89 | 19.9 | | 150 day SMA | 19.77 | 19.79 | 19.8 | | 200 day SMA | 19.86 | 19.86 | 19.86 |
|
|
