PitneyBowes PBI full analysis,charts,indicators,moving averages,SMA,DMA,EMA,ADX,MACD,RSIPitney Bowes PBI WideScreen charts, DMA,SMA,EMA technical analysis, forecast prediction, by indicators ADX,MACD,RSI,CCI NYSE stock exchange
operates under Miscellaneous sector & deals in Office Equipment Supplies Services
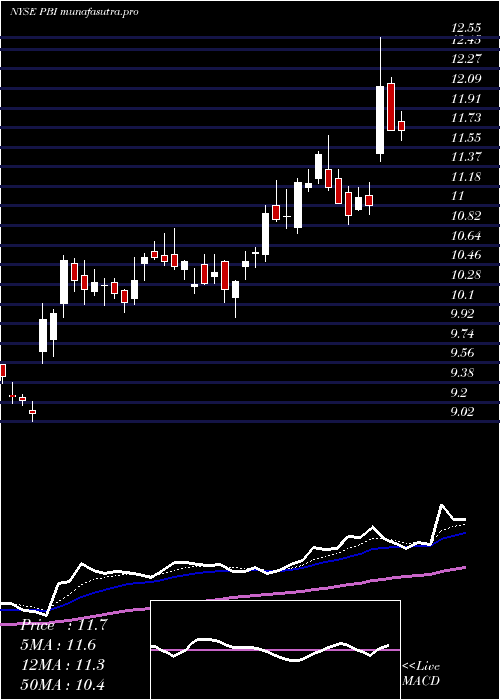
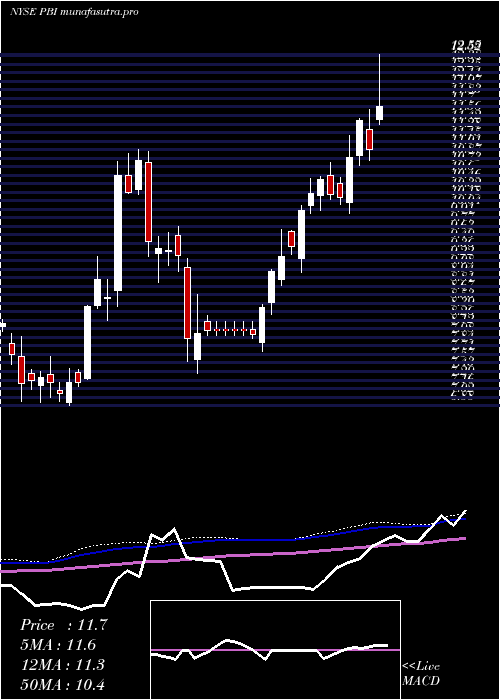
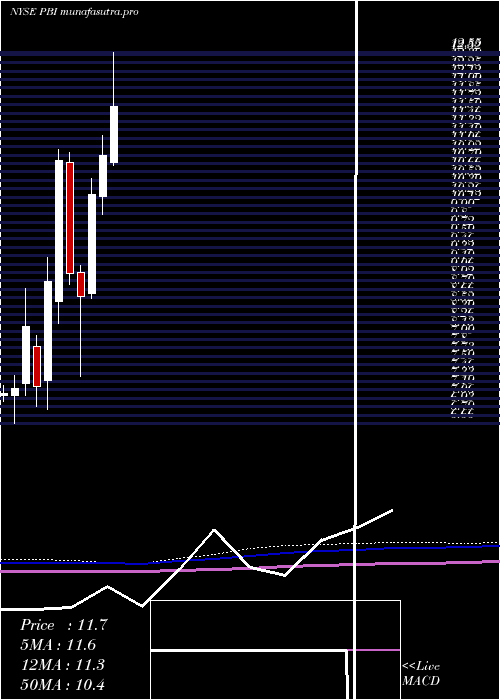
Daily price and charts and targets PitneyBowes Strong Daily Stock price targets for PitneyBowes PBI are 11.32 and 11.64 | Daily Target 1 | 11.08 | | Daily Target 2 | 11.23 | | Daily Target 3 | 11.396666666667 | | Daily Target 4 | 11.55 | | Daily Target 5 | 11.72 |
Daily price and volume Pitney Bowes
| Date |
Closing |
Open |
Range |
Volume |
Mon 20 October 2025 |
11.39 (1.06%) |
11.29 |
11.24 - 11.56 |
1.2184 times |
Fri 17 October 2025 |
11.27 (1.17%) |
11.19 |
11.12 - 11.34 |
1.1263 times |
Thu 16 October 2025 |
11.14 (-0.98%) |
11.29 |
11.07 - 11.30 |
0.8766 times |
Wed 15 October 2025 |
11.25 (2.09%) |
11.08 |
11.05 - 11.27 |
0.838 times |
Tue 14 October 2025 |
11.02 (0.27%) |
10.86 |
10.80 - 11.10 |
0.7674 times |
Mon 13 October 2025 |
10.99 (-0.18%) |
11.15 |
10.96 - 11.21 |
0.8007 times |
Tue 07 October 2025 |
11.01 (0.46%) |
10.99 |
10.93 - 11.16 |
1.368 times |
Mon 06 October 2025 |
10.96 (-1.44%) |
11.24 |
10.82 - 11.24 |
1.2548 times |
Fri 03 October 2025 |
11.12 (-1.33%) |
11.13 |
11.06 - 11.36 |
1.0382 times |
Thu 02 October 2025 |
11.27 (-0.79%) |
11.49 |
11.24 - 11.49 |
0.7117 times |
Wed 01 October 2025 |
11.36 (-0.44%) |
11.34 |
11.18 - 11.41 |
0.8433 times |
Weekly price and charts PitneyBowes Strong weekly Stock price targets for PitneyBowes PBI are 11.32 and 11.64 | Weekly Target 1 | 11.08 | | Weekly Target 2 | 11.23 | | Weekly Target 3 | 11.396666666667 | | Weekly Target 4 | 11.55 | | Weekly Target 5 | 11.72 |
Weekly price and volumes for Pitney Bowes
| Date |
Closing |
Open |
Range |
Volume |
Mon 20 October 2025 |
11.39 (1.06%) |
11.29 |
11.24 - 11.56 |
0.2285 times |
Fri 17 October 2025 |
11.27 (2.36%) |
11.15 |
10.80 - 11.34 |
0.8268 times |
Tue 07 October 2025 |
11.01 (-0.99%) |
11.24 |
10.82 - 11.24 |
0.4919 times |
Fri 03 October 2025 |
11.12 (-1.42%) |
11.41 |
11.06 - 11.49 |
0.9736 times |
Fri 26 September 2025 |
11.28 (-4.33%) |
11.65 |
11.14 - 12.15 |
1.243 times |
Fri 19 September 2025 |
11.79 (3.33%) |
11.60 |
11.17 - 11.79 |
1.4271 times |
Fri 12 September 2025 |
11.41 (-7.08%) |
12.50 |
11.23 - 12.78 |
2.1647 times |
Fri 05 September 2025 |
12.28 (1.32%) |
11.90 |
11.81 - 12.38 |
0.8836 times |
Fri 29 August 2025 |
12.12 (0%) |
11.97 |
11.95 - 12.19 |
0.2005 times |
Fri 29 August 2025 |
12.12 (2.54%) |
11.95 |
11.87 - 12.47 |
1.5604 times |
Fri 22 August 2025 |
11.82 (4.79%) |
11.17 |
11.09 - 11.93 |
1.3787 times |
Monthly price and charts PitneyBowes Strong monthly Stock price targets for PitneyBowes PBI are 11.1 and 11.86 | Monthly Target 1 | 10.49 | | Monthly Target 2 | 10.94 | | Monthly Target 3 | 11.25 | | Monthly Target 4 | 11.7 | | Monthly Target 5 | 12.01 |
Monthly price and volumes Pitney Bowes
| Date |
Closing |
Open |
Range |
Volume |
Mon 20 October 2025 |
11.39 (-0.18%) |
11.34 |
10.80 - 11.56 |
0.4037 times |
Tue 30 September 2025 |
11.41 (-5.86%) |
11.90 |
11.07 - 12.78 |
1.232 times |
Fri 29 August 2025 |
12.12 (6.69%) |
11.13 |
10.92 - 12.47 |
1.5454 times |
Thu 31 July 2025 |
11.36 (4.12%) |
10.81 |
10.75 - 13.11 |
1.4249 times |
Mon 30 June 2025 |
10.91 (5.92%) |
10.27 |
9.98 - 11.24 |
0.8247 times |
Fri 30 May 2025 |
10.30 (18.66%) |
8.72 |
8.64 - 10.55 |
0.8862 times |
Wed 30 April 2025 |
8.68 (-4.09%) |
9.06 |
7.40 - 9.17 |
0.8135 times |
Mon 31 March 2025 |
9.05 (-16.44%) |
10.80 |
8.87 - 10.97 |
0.8799 times |
Fri 28 February 2025 |
10.83 (21.55%) |
8.60 |
8.25 - 11.01 |
1.1456 times |
Fri 31 January 2025 |
8.91 (23.07%) |
7.34 |
6.88 - 9.29 |
0.8442 times |
Tue 31 December 2024 |
7.24 (-11.71%) |
7.88 |
6.93 - 8.05 |
0.5826 times |
DMA SMA EMA moving averages of Pitney Bowes PBI
DMA (daily moving average) of Pitney Bowes PBI
| DMA period | DMA value | | 5 day DMA | 11.21 | | 12 day DMA | 11.18 | | 20 day DMA | 11.37 | | 35 day DMA | 11.57 | | 50 day DMA | 11.56 | | 100 day DMA | 11.29 | | 150 day DMA | 10.45 | | 200 day DMA | 10.06 | EMA (exponential moving average) of Pitney Bowes PBI
| EMA period | EMA current | EMA prev | EMA prev2 | | 5 day EMA | 11.25 | 11.18 | 11.13 | | 12 day EMA | 11.25 | 11.22 | 11.21 | | 20 day EMA | 11.33 | 11.32 | 11.32 | | 35 day EMA | 11.4 | 11.4 | 11.41 | | 50 day EMA | 11.51 | 11.51 | 11.52 |
SMA (simple moving average) of Pitney Bowes PBI
| SMA period | SMA current | SMA prev | SMA prev2 | | 5 day SMA | 11.21 | 11.13 | 11.08 | | 12 day SMA | 11.18 | 11.17 | 11.17 | | 20 day SMA | 11.37 | 11.36 | 11.37 | | 35 day SMA | 11.57 | 11.59 | 11.62 | | 50 day SMA | 11.56 | 11.56 | 11.56 | | 100 day SMA | 11.29 | 11.27 | 11.25 | | 150 day SMA | 10.45 | 10.44 | 10.42 | | 200 day SMA | 10.06 | 10.04 | 10.02 |
|
|
