ProsperityBancshares PB full analysis,charts,indicators,moving averages,SMA,DMA,EMA,ADX,MACD,RSIProsperity Bancshares PB WideScreen charts, DMA,SMA,EMA technical analysis, forecast prediction, by indicators ADX,MACD,RSI,CCI NYSE stock exchange
operates under Finance sector & deals in Major Banks
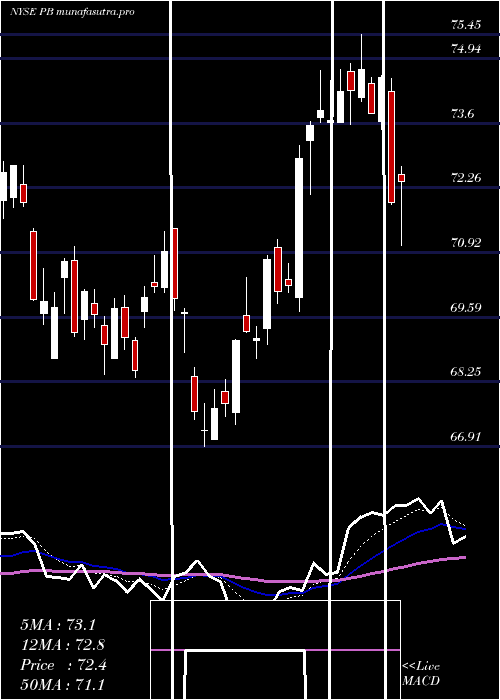
Daily price and charts and targets ProsperityBancshares Strong Daily Stock price targets for ProsperityBancshares PB are 63.61 and 64.82 | Daily Target 1 | 62.66 | | Daily Target 2 | 63.34 | | Daily Target 3 | 63.873333333333 | | Daily Target 4 | 64.55 | | Daily Target 5 | 65.08 |
Daily price and volume Prosperity Bancshares
| Date |
Closing |
Open |
Range |
Volume |
Mon 20 October 2025 |
64.01 (1.33%) |
63.50 |
63.20 - 64.41 |
1.1377 times |
Fri 17 October 2025 |
63.17 (2.07%) |
62.56 |
61.62 - 63.45 |
0.9476 times |
Thu 16 October 2025 |
61.89 (-4.67%) |
64.47 |
61.06 - 64.67 |
1.7768 times |
Wed 15 October 2025 |
64.92 (-1.77%) |
66.09 |
64.67 - 66.58 |
0.9428 times |
Tue 14 October 2025 |
66.09 (2.59%) |
64.15 |
64.15 - 66.52 |
0.919 times |
Mon 13 October 2025 |
64.42 (-1.8%) |
63.69 |
63.32 - 64.55 |
0.712 times |
Tue 07 October 2025 |
65.60 (-0.74%) |
66.37 |
65.53 - 66.72 |
0.526 times |
Mon 06 October 2025 |
66.09 (0.41%) |
66.56 |
65.77 - 67.16 |
0.7196 times |
Fri 03 October 2025 |
65.82 (0.37%) |
65.76 |
65.70 - 66.74 |
1.0831 times |
Thu 02 October 2025 |
65.58 (-2.06%) |
66.80 |
65.23 - 67.31 |
1.2353 times |
Wed 01 October 2025 |
66.96 (0.92%) |
66.52 |
66.03 - 67.10 |
1.5274 times |
Weekly price and charts ProsperityBancshares Strong weekly Stock price targets for ProsperityBancshares PB are 63.61 and 64.82 | Weekly Target 1 | 62.66 | | Weekly Target 2 | 63.34 | | Weekly Target 3 | 63.873333333333 | | Weekly Target 4 | 64.55 | | Weekly Target 5 | 65.08 |
Weekly price and volumes for Prosperity Bancshares
| Date |
Closing |
Open |
Range |
Volume |
Mon 20 October 2025 |
64.01 (1.33%) |
63.50 |
63.20 - 64.41 |
0.2775 times |
Fri 17 October 2025 |
63.17 (-3.7%) |
63.69 |
61.06 - 66.58 |
1.2922 times |
Tue 07 October 2025 |
65.60 (-0.33%) |
66.56 |
65.53 - 67.16 |
0.3038 times |
Fri 03 October 2025 |
65.82 (-1.1%) |
66.55 |
65.22 - 67.31 |
1.4563 times |
Fri 26 September 2025 |
66.55 (0.86%) |
65.91 |
64.94 - 67.10 |
1.0621 times |
Fri 19 September 2025 |
65.98 (-2.74%) |
67.25 |
64.26 - 67.52 |
1.6183 times |
Fri 12 September 2025 |
67.84 (-0.28%) |
67.97 |
66.74 - 68.15 |
1.2725 times |
Fri 05 September 2025 |
68.03 (-1.59%) |
68.56 |
67.67 - 69.65 |
0.9747 times |
Fri 29 August 2025 |
69.13 (0%) |
69.51 |
69.11 - 70.00 |
0.1898 times |
Fri 29 August 2025 |
69.13 (-0.79%) |
69.68 |
68.57 - 70.18 |
1.5529 times |
Fri 22 August 2025 |
69.68 (3.74%) |
66.98 |
66.67 - 70.16 |
1.2197 times |
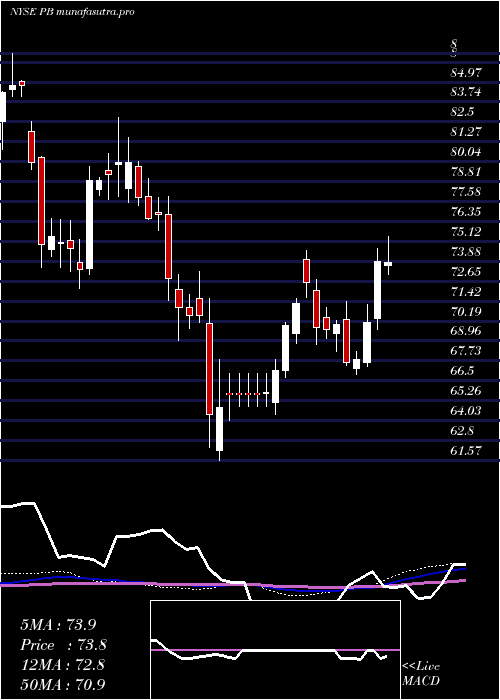
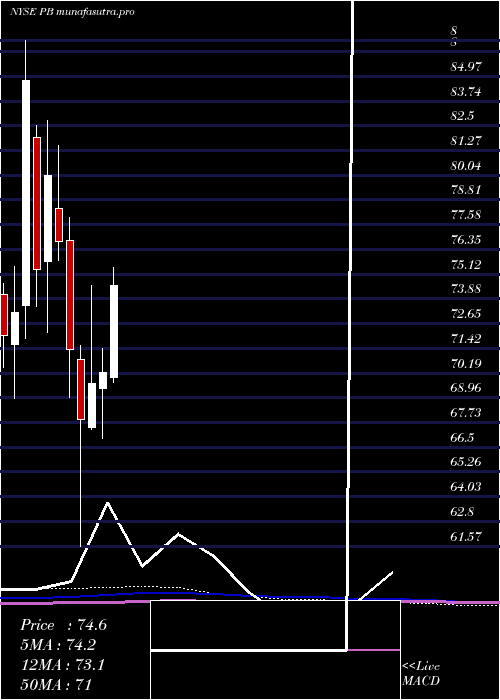
Monthly price and charts ProsperityBancshares Strong monthly Stock price targets for ProsperityBancshares PB are 59.41 and 65.66 | Monthly Target 1 | 57.88 | | Monthly Target 2 | 60.94 | | Monthly Target 3 | 64.126666666667 | | Monthly Target 4 | 67.19 | | Monthly Target 5 | 70.38 |
Monthly price and volumes Prosperity Bancshares
| Date |
Closing |
Open |
Range |
Volume |
Mon 20 October 2025 |
64.01 (-3.53%) |
66.52 |
61.06 - 67.31 |
0.7784 times |
Tue 30 September 2025 |
66.35 (-4.02%) |
68.56 |
64.26 - 69.65 |
1.5076 times |
Fri 29 August 2025 |
69.13 (3.77%) |
66.05 |
64.54 - 70.18 |
1.3757 times |
Thu 31 July 2025 |
66.62 (-5.15%) |
69.99 |
66.00 - 75.45 |
1.2477 times |
Mon 30 June 2025 |
70.24 (0.85%) |
69.42 |
66.91 - 71.42 |
0.8999 times |
Fri 30 May 2025 |
69.65 (2.58%) |
67.50 |
67.40 - 74.56 |
0.9361 times |
Wed 30 April 2025 |
67.90 (-4.86%) |
70.84 |
61.57 - 71.56 |
0.9545 times |
Mon 31 March 2025 |
71.37 (-7.02%) |
76.77 |
68.96 - 77.92 |
0.9005 times |
Fri 28 February 2025 |
76.76 (-4.05%) |
78.38 |
75.79 - 81.53 |
0.6036 times |
Fri 31 January 2025 |
80.00 (6.17%) |
75.72 |
72.20 - 82.75 |
0.796 times |
Tue 31 December 2024 |
75.35 (-11.07%) |
81.91 |
73.50 - 82.53 |
0.4858 times |
DMA SMA EMA moving averages of Prosperity Bancshares PB
DMA (daily moving average) of Prosperity Bancshares PB
| DMA period | DMA value | | 5 day DMA | 64.02 | | 12 day DMA | 65.08 | | 20 day DMA | 65.43 | | 35 day DMA | 66.44 | | 50 day DMA | 66.83 | | 100 day DMA | 68.51 | | 150 day DMA | 68.62 | | 200 day DMA | 70.7 | EMA (exponential moving average) of Prosperity Bancshares PB
| EMA period | EMA current | EMA prev | EMA prev2 | | 5 day EMA | 63.92 | 63.88 | 64.23 | | 12 day EMA | 64.7 | 64.83 | 65.13 | | 20 day EMA | 65.26 | 65.39 | 65.62 | | 35 day EMA | 65.91 | 66.02 | 66.19 | | 50 day EMA | 66.5 | 66.6 | 66.74 |
SMA (simple moving average) of Prosperity Bancshares PB
| SMA period | SMA current | SMA prev | SMA prev2 | | 5 day SMA | 64.02 | 64.1 | 64.58 | | 12 day SMA | 65.08 | 65.24 | 65.52 | | 20 day SMA | 65.43 | 65.52 | 65.62 | | 35 day SMA | 66.44 | 66.6 | 66.78 | | 50 day SMA | 66.83 | 66.87 | 66.93 | | 100 day SMA | 68.51 | 68.57 | 68.66 | | 150 day SMA | 68.62 | 68.66 | 68.71 | | 200 day SMA | 70.7 | 70.76 | 70.82 |
|
|
