ParTechnology PAR full analysis,charts,indicators,moving averages,SMA,DMA,EMA,ADX,MACD,RSIPar Technology PAR WideScreen charts, DMA,SMA,EMA technical analysis, forecast prediction, by indicators ADX,MACD,RSI,CCI NYSE stock exchange
operates under Miscellaneous sector & deals in Office Equipment Supplies Services
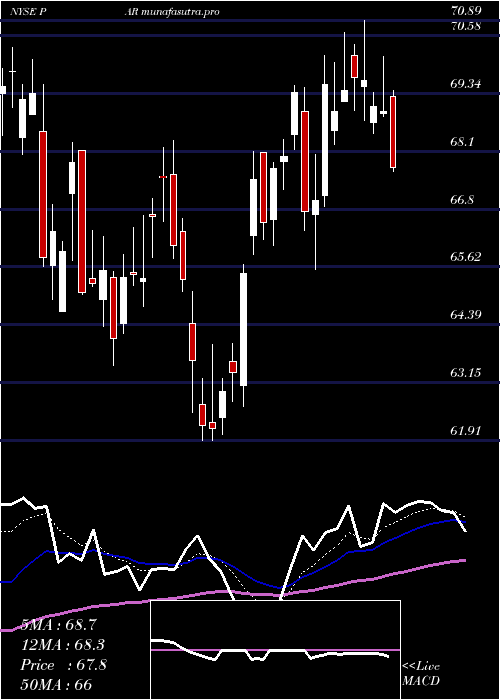
Daily price and charts and targets ParTechnology Strong Daily Stock price targets for ParTechnology PAR are 33.6 and 34.69 | Daily Target 1 | 33.35 | | Daily Target 2 | 33.84 | | Daily Target 3 | 34.44 | | Daily Target 4 | 34.93 | | Daily Target 5 | 35.53 |
Daily price and volume Par Technology
| Date |
Closing |
Open |
Range |
Volume |
Fri 05 December 2025 |
34.33 (-0.41%) |
34.35 |
33.95 - 35.04 |
0.6424 times |
Thu 04 December 2025 |
34.47 (-1.57%) |
35.35 |
34.05 - 35.62 |
0.7472 times |
Wed 03 December 2025 |
35.02 (3.7%) |
33.88 |
33.76 - 35.05 |
0.9677 times |
Tue 02 December 2025 |
33.77 (-1.6%) |
34.67 |
33.75 - 35.07 |
0.38 times |
Mon 01 December 2025 |
34.32 (-0.55%) |
33.96 |
33.78 - 34.92 |
0.8219 times |
Fri 28 November 2025 |
34.51 (1.26%) |
34.33 |
34.30 - 34.85 |
0.3878 times |
Wed 26 November 2025 |
34.08 (-0.12%) |
33.89 |
33.61 - 34.45 |
0.7372 times |
Tue 25 November 2025 |
34.12 (3.33%) |
33.32 |
33.15 - 34.40 |
0.9571 times |
Mon 24 November 2025 |
33.02 (-1.43%) |
33.13 |
32.50 - 33.83 |
1.327 times |
Fri 21 November 2025 |
33.50 (4.39%) |
32.19 |
31.65 - 34.04 |
3.0317 times |
Thu 20 November 2025 |
32.09 (-5.51%) |
34.43 |
31.89 - 34.98 |
1.9652 times |
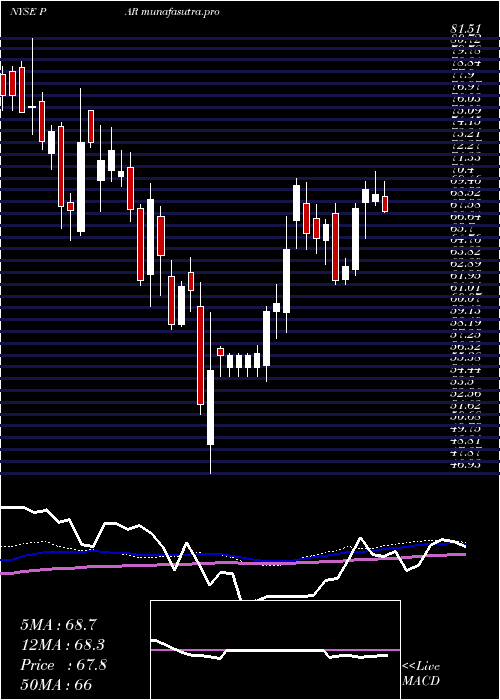
Weekly price and charts ParTechnology Strong weekly Stock price targets for ParTechnology PAR are 34.04 and 35.91 | Weekly Target 1 | 32.7 | | Weekly Target 2 | 33.51 | | Weekly Target 3 | 34.566666666667 | | Weekly Target 4 | 35.38 | | Weekly Target 5 | 36.44 |
Weekly price and volumes for Par Technology
| Date |
Closing |
Open |
Range |
Volume |
Fri 05 December 2025 |
34.33 (-0.52%) |
33.96 |
33.75 - 35.62 |
0.5666 times |
Fri 28 November 2025 |
34.51 (3.01%) |
33.13 |
32.50 - 34.85 |
0.5428 times |
Fri 21 November 2025 |
33.50 (-13.88%) |
38.63 |
31.65 - 38.63 |
1.6497 times |
Fri 14 November 2025 |
38.90 (0.59%) |
38.80 |
37.22 - 39.69 |
1.1957 times |
Fri 07 November 2025 |
38.67 (9.42%) |
35.05 |
32.57 - 38.95 |
1.1141 times |
Fri 31 October 2025 |
35.34 (0%) |
34.91 |
34.67 - 35.59 |
0.2839 times |
Fri 31 October 2025 |
35.34 (-2.46%) |
36.74 |
34.22 - 37.08 |
1.1954 times |
Fri 24 October 2025 |
36.23 (3.34%) |
35.42 |
34.86 - 37.43 |
1.0698 times |
Fri 17 October 2025 |
35.06 (-3.15%) |
36.47 |
34.33 - 37.68 |
1.2868 times |
Fri 10 October 2025 |
36.20 (-6.46%) |
38.89 |
36.00 - 39.03 |
1.0952 times |
Fri 03 October 2025 |
38.70 (-2.96%) |
40.03 |
37.42 - 40.52 |
1.4167 times |
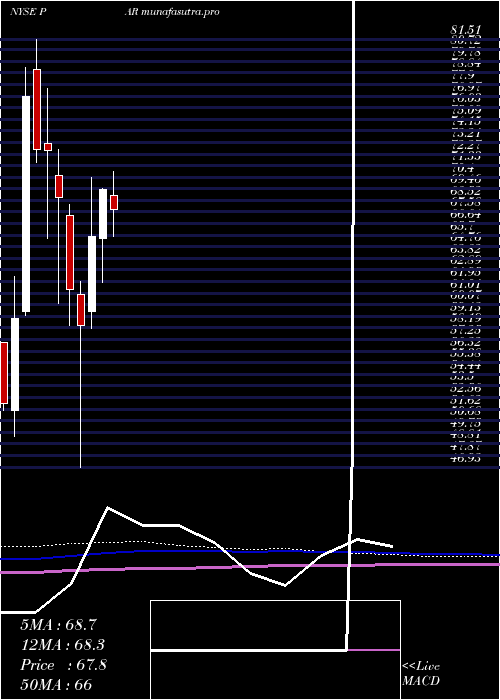
Monthly price and charts ParTechnology Strong monthly Stock price targets for ParTechnology PAR are 34.04 and 35.91 | Monthly Target 1 | 32.7 | | Monthly Target 2 | 33.51 | | Monthly Target 3 | 34.566666666667 | | Monthly Target 4 | 35.38 | | Monthly Target 5 | 36.44 |
Monthly price and volumes Par Technology
| Date |
Closing |
Open |
Range |
Volume |
Fri 05 December 2025 |
34.33 (-0.52%) |
33.96 |
33.75 - 35.62 |
0.1501 times |
Fri 28 November 2025 |
34.51 (-2.35%) |
35.05 |
31.65 - 39.69 |
1.1927 times |
Fri 31 October 2025 |
35.34 (-10.71%) |
39.54 |
34.22 - 40.03 |
1.5475 times |
Tue 30 September 2025 |
39.58 (-22.67%) |
50.00 |
38.44 - 51.18 |
1.6871 times |
Fri 29 August 2025 |
51.18 (-15.79%) |
59.40 |
46.24 - 61.23 |
1.9703 times |
Thu 31 July 2025 |
60.78 (-12.38%) |
68.95 |
60.48 - 72.15 |
0.6649 times |
Mon 30 June 2025 |
69.37 (5.81%) |
65.40 |
61.91 - 69.50 |
0.6374 times |
Fri 30 May 2025 |
65.56 (12.26%) |
59.55 |
58.12 - 70.33 |
0.7803 times |
Wed 30 April 2025 |
58.40 (-4.79%) |
60.90 |
46.93 - 61.98 |
0.6913 times |
Mon 31 March 2025 |
61.34 (-10.73%) |
67.31 |
58.38 - 68.16 |
0.6785 times |
Fri 28 February 2025 |
68.71 (-5.35%) |
70.50 |
60.20 - 72.60 |
0.6175 times |
DMA SMA EMA moving averages of Par Technology PAR
DMA (daily moving average) of Par Technology PAR
| DMA period | DMA value | | 5 day DMA | 34.38 | | 12 day DMA | 33.93 | | 20 day DMA | 35.66 | | 35 day DMA | 35.51 | | 50 day DMA | 36.14 | | 100 day DMA | 44.57 | | 150 day DMA | 51.81 | | 200 day DMA | 53.75 | EMA (exponential moving average) of Par Technology PAR
| EMA period | EMA current | EMA prev | EMA prev2 | | 5 day EMA | 34.39 | 34.42 | 34.39 | | 12 day EMA | 34.58 | 34.62 | 34.65 | | 20 day EMA | 34.97 | 35.04 | 35.1 | | 35 day EMA | 35.79 | 35.88 | 35.96 | | 50 day EMA | 36.41 | 36.49 | 36.57 |
SMA (simple moving average) of Par Technology PAR
| SMA period | SMA current | SMA prev | SMA prev2 | | 5 day SMA | 34.38 | 34.42 | 34.34 | | 12 day SMA | 33.93 | 34.06 | 34.25 | | 20 day SMA | 35.66 | 35.61 | 35.58 | | 35 day SMA | 35.51 | 35.52 | 35.56 | | 50 day SMA | 36.14 | 36.25 | 36.39 | | 100 day SMA | 44.57 | 44.92 | 45.25 | | 150 day SMA | 51.81 | 51.98 | 52.14 | | 200 day SMA | 53.75 | 53.9 | 54.06 |
|
|
